Welcome to nectaexams.com, the best study material blog for Tanzanian students. Topographical map interpretation is a crucial skill for Form Five Geography students. These maps provide a detailed representation of the Earth’s surface, showing natural and man-made features with precision. Understanding how to read and interpret topographical maps is essential for various applications, from navigation and planning to environmental studies and geographical analysis. In this topic, we will delve into the fundamental concepts of topographical maps, including symbols, scale, contour lines, and how to extract valuable information from these maps. By mastering these skills, students will enhance their geographical knowledge and be better prepared for both academic and real-world challenges.
TOPOGRAPHICAL MAP INTERPRETATION
INTRODUCTION TO A MAP
What is a map?
Map is a scaled conventional representation of the whole or any of the earth’s surface on a flat body.
Or
A scaled conventional visual representation usually on a plane surface of a region of the earth.
Flat body into which maps, established include, a piece of paper , blackboard, wall, wood, cloth and others of the same consideration.
Maps are the most valuable and powerful equipments in Geography as used for providing geographical details of varied areas represented. They are geographical details of varied areas represented. They are also used for storing the geographical details of areas represented. Some of the geographical facts which can to depicted by maps about areas represented include; climate, relief, human activities, soils, drainage system, vegetation, settlement, settlements, communication and others of similar consideration. It is thus; maps are so useful for making geographical facts description about the respective areas represented. Other useful tools apart from maps which also enhance geographical studies; graphs, globes, globes, ground photographs, aerial photographs and the satellite images.
CATEGORIES OF MAPS
Maps used in geographical studies are extremely varied and belong to different forms. They are classified by considering the following categorizing factors.
- heir varied functions
- Scale size used
- The degree of accuracy
Maps according to functions
Classification by function, it is taken into consideration of what a particular map shows. Maps portray varied geographical facts and thus are of different functions depending on what shown. With respect to this, map are broadly categorized into four and include the following.
(a) Topographical maps
(b) thematic maps
(c) Statistical maps
(d) Cadastral maps
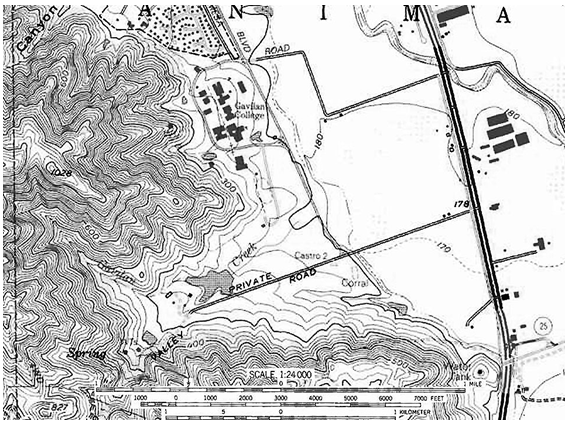
TOPOGRAPHICAL MAPS.
The maps are named with the world ‘topography’ which has been derived from a Greek world of ‘Topos’ The word topos means the actual appearance of a place by its natural and artificial features.
Or
. The map which has been designed to give a general future (description) of the landscape of a very limited part of a country by showing both natural and artificial features.
Or
Map whose principle purpose is to portray and identify the features of the earth’s surface as faithfully as possible with in the limitation imposed by scale.
Topographical maps considerably to their future of function are also known as general maps.
Characteristics of topographical maps
- Show both natural and artificial features of areas represented.
- They are drawn on their medium or large scale depending on the size of the area represented.
- Represent small or limited parts of a country
- They are more detailed as represents small parts on large scale.
Thematic maps
These are the special maps which concentrate on showing the spatial distribution of a single geographical phenomena among the several of areas represented.
Or
Types of map especially designed to show particular theme connected with specific geographical areas. i.e. they show the distribution of only one geographical fact among the several of a particular region. These can portray physical, social, political, economic, or any other espects of a city, state, region, continent and world at large.
Thematic maps are differently named according to the nature of content (details) of an area represented and include the following:-
- Relief maps:- These show the physical appearance of areas represented by giving the major land forms.
- Political maps:- They show political boundaries of administrative for regions represented.
- Geological maps: The maps concentrate on showing the geological nature for the regions represented.
- Soil maps: The ones which show the spartial variation of soil nature for areas represented.
- Economic maps: These show the spatial distribution of chiefs crops, animals, industries, minerals and others.
- Historical maps: show the distribution of the historical sites.
Statistical maps.
These are the geographical maps which show the distribution of certain geographical phenomena in values of phenomena of interest in geographical studies lie temperature, population density, movement of goods or people and others of related. With the use of statical maps, one can make quantitative analysis of a phenomena for the area shown on the map.
Statistical maps are further differentiated by considering the means used to show the values of distribution on the map face. Owning to the consideration, statistical maps include the following:-
Isopleths maps.
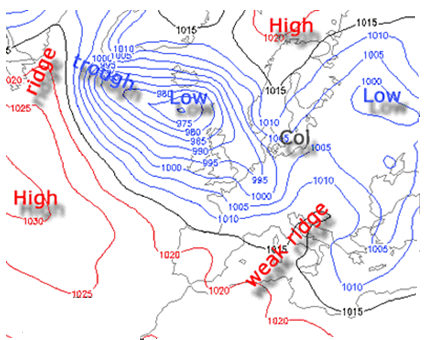
These statistical maps which show the distribution of a certain geographical phenomena in quantitative manner by of lines. The lines are established on a map face to join points with equal amount of distribution with reflection to an actual area on the earth’s represented.
The used lines have special names depending on a nature of phenomena shown on the map.
- Isohyets: for rain fall
- Isotherms: for temperature
- Isobars: for atmospheric pressure
- Isohaline: for salinity
- Isobaths: for ocean depth
Dot maps.
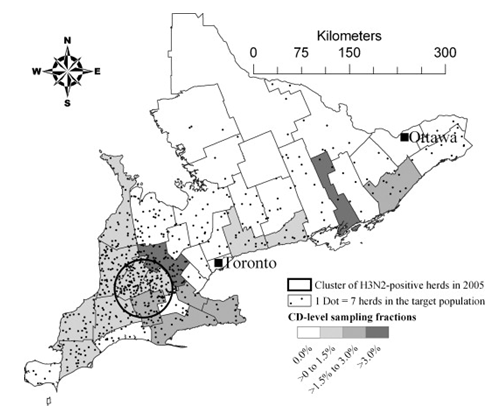
Such statistical maps designed to show values on spatial distribution of a certain geographical phenomena by means of fixed size dots as inserted on a map face. Each dot on the map carries equal values similarly to others.
Choropleth maps.
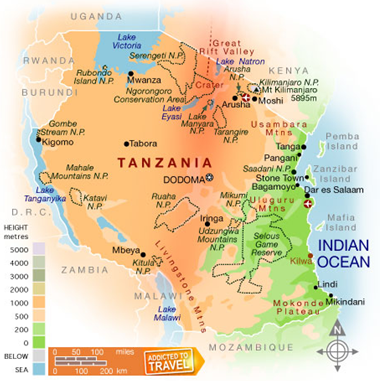
These statical maps are designed to show values on the distribution density of a certain geographical phenomena like that of population by means of varied shade texture. The map is established to have a key to interpret the categories of quantitative values represented by the varied shades.
Flow line maps:
These are designed to show the quantitative values on movement of certain geographical phenomena like passengers or goods from one place to another through an established route way of like: a d, railway, water way and others by means of flow lines of varied width. i.e. the amount on movement reflected by the width of the flow lines.
Cadastral maps
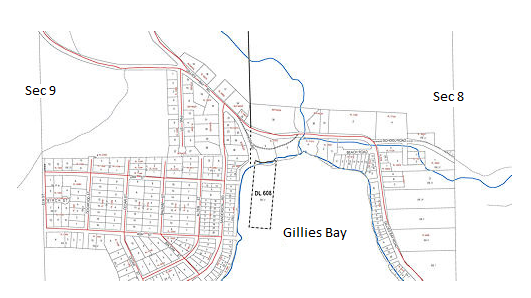
They are the maps of large scale which show more Clearly the layout and boundaries of features of a very small size represented. i.e. The maps show precise locations and names of the features of the area represented.
Cadastral maps are mostly designed for ownership purpose. These maps may show the layout of features in a village, part of a town, industrial area, school compound, home steady and others of the same reflection.
Cadastral maps are commonly designed after the boundaries of the features in the area to have been accurately surveyed. The type of survey that concentrates on taking the actual measurements of features boundaries is known as cadastral survey. It is thus the maps are named in basis of the technique used to get details that appear on the map.
Maps according to scale size.
Maps being much smaller in size compared to actual areas represented, are precisely designed up on distances to grounds represented. However the maps size of the ground and amount of details shown, Being drawn up on varied scale size, makes maps appear extremely varied and this becomes another important categorizing factor of maps. It is thus, maps according to scale size categorized into the following types.
- Large scale maps
- Small scale maps
- Medium scale maps
Large scale maps.
These are drawn on large size to give larger representation of limited parts of a country like a town or village. These commonly established on large spaces of flat bodies.
Characteristics of large scale maps
- They are drawn on large scale size e.g. 1:10,000, 1:20,000 etc.
- The maps give larger representation of areas portrayed.
- They represent very limited parts of the country
- They are more detailed.
Small scale maps.
These are the geographical maps drawn on small scale representing larger area size of the earth’s space of the body.
Characteristics of small scale maps:
- They are drawn on small scale e.g. 1:1,000,000, 1:10,000,000 etc.
- The maps give smaller representation of the areas of the earth’s surface.
- They commonly represent very huge parts of the earth’s surface like a country, continent or the whole of the earth’s surface.
- The maps are more selective and thus, show less details of represented due to the limitation of map space.
Medium scale maps.
These are the maps drawn on medium scale size to represent parts of the earth’s surface.
Characteristics of the medium scale maps
- They are drawn on the medium scale size E.g. 1:100,000,1:25,000,1:150,000 and others of the same consideration.
- Both the map and ground represented are of medium size.
- The maps show moderate level of details.
Maps according to degree of accuracy.
Cartographers try to their level best to make maps most accurate in order to reflect the reality of areas portrayed. They employ varied techniques to make maps be of reasonable accuracy, However, with respect to this consideration, some maps are made accurate, while others not accurate and thus: maps differ in the degree of accuracy and this also taken as maps according to the degree of accuracy broadly classified into two types and include:
- Outline maps
- Accurate maps
Outline maps.
These are the simple maps which not accurately designed as drawn not up on scale. They are commonly shown in text books to make simple illustration of the geographical facts. Moreover, they are commonly printed or copied for personal or classroom uses.
Accurate maps.
These are the ones which have been precisely designed as drawn with the use of correct measurements of the area, its features as well as the map itself. i.e. the maps accurately designed with up on scale. Commonly on the map, the represented area and the features made to have correct size.
Accurate maps are subdivided into two depending up on the technology used o maintain the accuracy.
Surveyed maps.
These are the maps made accurate taken by actual measurements on distance, area represented. Most of the topographical maps correspond to this category.
Project maps
These are the maps which show the accuracy of the earth’s surface curvature (spherical shape) on their faces maintained by the cartographic technique of projection.
USEFULNESS OF MAPS
- Maps provide good basis for making orderly geographical facts description of regions represented. i.e. The geographical facts of an area such relief, drainage, settlement, communication,vegetation and others easily recognized and described from the topographical map.
- They provide ideal insight into significant relationship between geographical f variables. I.e. They are considered to establish the relationship between the geographical variables . E.g and soil,relief and vegetation, climate and vegetation etc.
- In connection to above point, maps are so powerful tools for making spatial analysis of geographical facts for areas represented. i.e. from map , the determinant factors for spatial variation of geographical phenomena detected.
- They are so potential for field studies.
- Maps are useful for traveling purpose. They guide people to reach points of designation· Maps are useful for locating the position of geographical features .It is achieved by a wide range of methods mostly, grid reference, place naming the use of latitudes and longitudes bearing and distance.
- Maps make storage of the geographical facts of areas represented. Hence the give insight to the previous appearance of areas.
- Maps can be used to make quantitative analysis of certain geographical facts like size, distance, gradient, drainage density in response to scale consideration.
- Maps are used for military purpose. i.e. they used to develop military strategies by providing vital details to military troops.
- Maps are used in the conduct of a wide range of projects like: population census, land use planning, building design, construction of roads and others of the same reflection.
SET BACKS OF USING MAPS.
- Maps are convention, and thus do not give the morphology of features represented. Features on maps appear by means of convention signs, symbols and abbreviations.
- Maps are selective. It is not possible for all details to appear on the map. Hence: with the use of maps in geographical studies, we lack some of the details.
- The features shown on the maps may not be all maintained on a constant scale. It is thus, uses may get distorted measurements of the features from the map.
- Maps may provide the outdated details about the respective areas represented. It is automatically set as details in actual areas may change with time while maps once designed remain unchanged. Moreover, it becomes difficult to update the map that has already been designed.
- The reading and interpretation of maps needs high and perfect skill.
- Maps are not capable to record and keep instant data
EXERCISE
Qn. Briefly explain any five merits of such topographical map to a map user (NECTA 2000 – The extract map of madukani series 742)
Qn. Outline the strengths and weakness of using topographical maps in geographical studies. Mock –
CONTENT OF MAPS
Map content refers to a body of information inserted on a map with reflection to the actual area represented. i.e. the details shown on a map which reflect the nature of the area represented or what generally contained on the map.’
The content established on topographical maps are so varied and thus ; classified into three categories of the following:-
- Natural contents:-The features which are distinctive from man made. They include: relief features, drainage features, vegetation features and others.
- Artificial contents: These are considerably to the features of man made such as cemetery, roads, railways, settlements, airfield and others of the same reflection.
- Supportive contents: These are the marginal details established to make well defined. Some of the supportive details include: scale, heading, key, date of compilation, northern direction and others of the same reflection.
FACTORS WHICH DETERMINE CONTENT OF MAPS
Most of the maps do not show (have) similar content i.e. details are considerably varied from map to maps. For instance: a map of Africa observed to show political boundaries of the countries, while the other shown physical appearance of the continent. Moreover: a map may appers more detailed; while the concluded that, variation of details on maps occurs as functioned by certain of details on maps occurs as include the following:-
- Objectivity of the map drawn
- Scale size of the map used
- Date of compilation
- The nature of the area represented
- The nationality of the cartographer
1.Objective of the map drawn
This largely depends on the aim of the cartographer (map maker). Usually maps are selective as it is difficult for all surface details to appear the map. Hence any map reflects its purpose.
2.Scale size of a map used
Maps are drawn on varied scale size depending on the size of the ground and size of the map it self. It has to be taken into consideration that, scale size of a map is what determines the amount of details of an area to be shown on the map, in common, a map drawn on a small scale is made to have limited space and less details would have been shown on it. Conversely to a map drawn on large scale , is made to have large space and very possible to display a lot about the represented area.
3.Date of compilation
Date of compilation refers to a period of time when a map was designed. It has to be taken into consideration that, land details are dynamic over time. With respect to this, a map is likely to show details which were present by the time of its designation. It is likely to have variation in details.
4.The nature of the represented area
A map shows what is found in the represented area and not otherwise. Therefore, maps which details.It is thus, a map reflects the reality of the area represented.
5.Nationality of the cartographer.
A map to represent part of the earth’s surface can be constructed by the foreigner or local cartographer. The two maps may differ in content due to the fact that, the foreigner cartographer might not to include some surface details because of being not familiar with the area. Moreover the foreigner cartographer may misname the places on the map of the region represented.
EXERCISE
Q. (a) What factors affect the content of topographical map?
(b) Classify the features that are commonly shown on topographical maps. (NECTA 1991)
Q. Explain the factors that affect that affect the content of topographical maps. (NECTA 2008)
CARTOGRAPHY
Cartography is an art or a science of designing a map to represent either the whole or any part of the earth’s surface in scaled and conventional form.
There are noticeable contrasts between maps and the whole or parts of the earth’s surface represented as follow:-
·Map is flat, while the earth’s surface or part of the earth’s surface is not flat.
· Maps are much smaller in size, while the whole earth or a part of the earth represented is much larger in size.
With this the map makers use a cartographic technique to maintain the accuracy of the earth’s shape and size on maps. The technique is known as map projection. It is thus; the cartographic technique is associated with map projection. It is thus; the cartographic technique is associated with map projection as a sole means of maintaining accuracy of areas on maps.
MAP PROJECTION
The earth’s surface can be wholly represented with reasonable accuracy on a globe. But globes are not as convenient as flat maps to use. Globe can not depicts much details like transportation system of a city, or the location of very small towns or villages. With this, maps have to be produced to facilitate geographical studies.
To make the maps so accurate, a cartographic technique of map projection is defined as the cartographic technique of transforming the shape of the earth’s surface or part of the earth’s surface more accurately to a plane surface to develop a map that can be easily worked with less distortion. i.e. It is the cartographic technique of maintaining the accuracy of an area on a map.
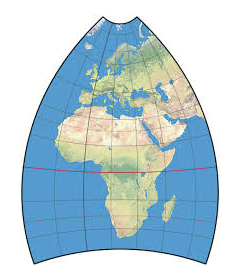
The cartographic technique of map projection is recognized be of varied types as flat bodies into which maps developed differently projected. This develops cylindrical, conical and plane map projections
The cartographic technique of map projection is recognized be of varied types as flat bodies onto which maps developed differently projected. This develops cylindrical,conical and plane map projections. More over;on a map, the features are made to have accuracy on different respects. This also develops the types of azimuthal, gnomic and stereo graphic map projections.
Cylindrical projection
By cylindrical projection, the shape of the earth’s surface is accurately maintained as a frat body onto which a map would be drawn, projected to a shape of the earth’s surface is maintained and then the cylindrical projected body is cut to develop flat map onto which the whole earth surface appears.
Cylindrical projection is alternatively known as mercators projection.

Conical projection
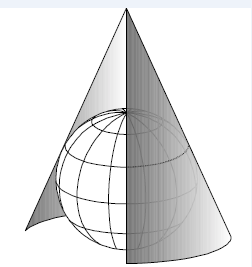
It is a considerable form of map projection, by which, the shape of the earth’s surface is accurately maintained as a flat body onto which a map would be drawn is projected to a conical shape. Over the surface of projected conical body, the shape of the earth’s surface is maintained then the conical body is cut to develop a flat map onto which the whole earth’s surface or part of the earth surface appears.
Plane projection
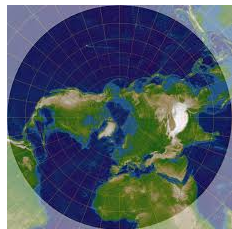
By plane projection, the area particularly of a limited size whose accuracy is directly maintained on a flat body os a piece of paper.
Azimuthal projection
It is a type of map projection which mostly used to maintain the correct distribution of the surface features on a map by being maintained in true directons and distance relatively to one another with reference from the centre of a map and up on the actual area on the earth’s surface. By this, all bearings are laid off correctly from the central point of the map, so that all points on the map and up on the area on the earth’s surface are true in distance and direction from the centre.
Gnomic projection
It is alternatively known as equi-distance projection. This is used to maintain the accuracy of ground distances on the map with respect to the used scale by regarding the relative bearing of the features in the area.
Streographic projection
It is a cartographic technique of preserving the correct shape of earth’s surface features on a map. Preservation of the features is maintained by taking into consideration of the satellite images and aerial photographs.
FACTORS INFLUENCING CARTOGRAPHIC PROCESS
(KEY ISSUE CONSIDERED IN MAP MAKING)
I n a process of map making a present a certain part of the earth’s surface, the following should be taken into consideration as guides to map maker.
- The size of the actual area to be represented on a map. The size of the area is revealed by making survey or by examining the vertical photograph that represents the same area.
- Size of the plane surface of a piece of paper onto which a map would be designed.
- ·Map scale. The scale is determined by relating the corresponding distance between the map and ground. Scale is what determines the amount of details about the area appear on the a map.
- Methods of projection as means of maintaining the accuracy of the map.
- Nature and amount of the features to be shown on a map. This largely depends on a type of map would be designed under plan and chosen scale size.
PROCEDURE IN MAP MAKING
The construction of a map involves the following important steps:-
(a) the cartographer has to make overall plan of a kind of map to be designed. The plan depends on what is intended to appear on the map about the area. i.e. the plan can be design : topographical map[, statistical map, thematic map or cadastral map.
(b) Collection of data from the area to be mapped. The nature of data to be collected depends on a type of map to be prepared. For instance; if the plan is to prepare a topographical map, the cartographer would have to collect the general geographical details of both natural and artificial features present in the area.
Data can be collected by involving the following methods.
· Making of the field survey in the area.
·By examining the respective vertical aerial photographs.
· By examining the respective satellite images.
· Data can be delivered from the existing sources like books and other maps.
(c) Choice of a scale. This has to take into consideration of both, size of the flat body of a sheet of paper and the size of the ground to be mapped. The scale is determined by relating the corresponding measurements on distance between the map and ground.
(d) Representation of the data or details on the map. The data can be represented by means of the conventional symbols, varied colours, varied shade textures, writing the names of features or places and other important means.
(e) the map should be given with the supportive details to make it well defined. These include; title, key, north directions, scale, date of compilation and others of the same importance.
LIMITATIONS IN MAP MAKING.
(a) Determination of the map scale; by relating the corresponding distances between the map and ground. The uses scale might have been assessed by using wrong measurements between the map and ground. For instance; the surveyed ground distance to be related to map distance might have been subjected to errors accumulation.
(b) Difficulties in cartographic representation. It is much based to the representation of the features on a map. The problem a rise on the following.
· What to be shown on a map regarding that, a map is selective in nature. i.e. It is more difficult to make all details appear on a map.
· Representation of the data of the map by inserting the name of the features, conventional signs and symbols, colors and shades. All these require high skill.
· Dynamism problem. Areas mapped subjected to changes. This makes maps appear outdated. Moreover; it becomes much difficult to update the map.
· It becomes much difficult for all features maintained on a constant scale of the map.
(c) Human problems
(i) technology
The designing of maps requires higher technology. This makes most of the maps designed manually and become not exactly accurate.
(ii) Financial problems
The making of a map is a expensive process. This makes maps not recurrently produced.
(iv)Poor communication
This greatly hinders the process of data collection in areas that would be mapped.
EXERCISE
Q. Write briefs notes on map projection (DSM – Mock 2003)
Q.
(a) Differentiate between thematic and topographical maps.
(b) Outline the problems encountered in a process of map making. MOCK – Qn.)
ESSENTIAL OF MAP
These are the supportive details given on a map to make it well defined with reflection to an actual area on the earth’s surface represented. Such details make the map well understood and interpreted to recognize clearly the geographical facts of the area represented. The are usually given on the map border. Absence of these on the map, makes difficulties in map reading and interpretation.
The main essentials of maps include the following.
(1) Title
It is a heading of a map designed. The significance of it is to tell what the map is for about. This is commonly indicated at the top of the map; and on other maps appear at bottom.
Map title is of two forms depending on what the map shows and include:-
General title
It is given to a map that shows the general geographical details of an area represented. It is established by writing only the name of a region represented. This form of title commonly appears on a topographical map. E.g. MOROGORO.
Specific title,
This is made to appear on a map that shows specific content among of the several about the represented area. Specific title mostly appears on thematic and statistical maps. E.g. MOROGORO LAND TRANSPORT LAYOUT.
(2) Key
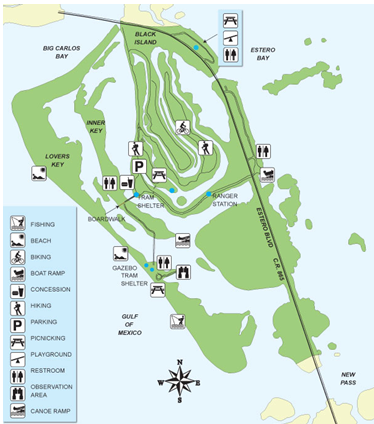
It is the list of all conventional symbol, signs and abbreviations together with their meaning on the map border. Maps are conventional in nature as represent land features by means of conventional symbols, signs and initials or abbreviations. It is therefore significantly potential, in order to make a map well defined and understood, it should be established with a key to show what the conventionas symbols, signs and abbreviations or initials stand for.
(3) Scale
A map is much smaller in size compared to the actual area represented which is much larger in size. It is thus, maps are accurately designed up on scales.
It is therefore important for the used to appear on a map in such a way map user may take into consideration of it for futher assessment.
Scale on a map enables the users to understand the relation ship of distance to ground, which then helps to understand the bigness of the area represented and other ground measurements of interest like distance and gradient.
Scale on the map is expressed in three varied ways and these include:-
· In representative fraction. E.g. 1;50,000
· In statement (verbal expression) eg, 1 cm on a map represents 2kms on the ground.
· Graphically; e.g.

(4) Indication of north direction
Any map should be indicate with north direction. On topographical map is commonly indicated by the following conventional sign.

The significance of north direction indication on a map is to enable the map uses to recognize readily the north direction and other important directions of like; North west, East, North east etc, of the represented area. Beside to this; the indicated north helps and features on the map and up on the respective area represented on the earth’s surface.
It has to bear in mind that, bearing of an observation line between two points is measured clockwise from north direction of 0000
(5) Margins
It is the frame work of the map designed. The role of a margin is to show the end of the represented area; and also makes the map impressive and attractive to the users.
(6) Date of compilation.
It is a date of map publication. It is very important for a date of compilation to appear on map. The enables the users to realize the following:-
· Whether the map is updating or outdated relatively to the actual appearance of the respective area represented.
· The changes which have occurred in the area. This can be realized by comparing the latest map to other maps or the given map to the current appearance of the area.
· To calculate magnetic variation of a place by taking into consideration of the rate of changes per annum. Be side to this, it may also help to calculate the new magnetic bearing of an observation line from a place to another place.
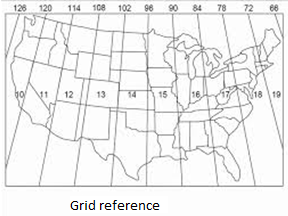
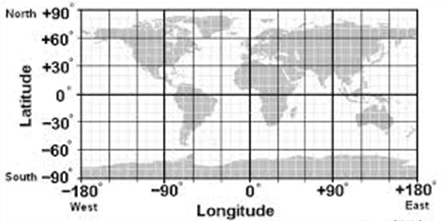
(7) Grid lines and latitudes and longitudes.
Grid lines are the vertical and horizontal lines drawn on a map face crossing at right angles giving so perfect squares. The lines are numbered to make eastings and northing.
Latitudes and longitudes are the imaginary angular distance lines drawn on the face of map and given with the degree numbers as have been measured more accurately from the centre of the earth’s surface. These represent the angular distance of the area on the earth’s surface from the centre.
Grid lines, latitudes and longitudes in general, have a potential significance of enabling people using map to locate position of geographical features on the map with reflection to actual areas represented.
Moreover; the latitudes and longitudes enable map mapped areas from the centre of the earth.
Note.
The grid lines are commonly established in more details on large scaled maps as they represent small areas. While, the latitudes and longitudes are widely printed on small scaled maps as they represent wider parts of the earth’s surface.
(8) Map identification details.
These included both; serial number and sheet number of the map. The are potentially significant in recognizing easily the maps and also make clear distinction map to maps.
(9) Publisher and copy writer owner.
It is important that, to any map the name of the cartographer or institution constructed the map has to appear. This may help the map users to make necessary consultation with the cartographer or institution constructed the map has to appear. This may help the map users to make necessary consultation with the cartographer or institution to have more clear details about the area which has been mapped.
MAP SCALE
Maps are all generally, much smaller in size as it an be compared to the actual areas represented which are much larger in size. Hence; a map scale is a relationship of map distance to ground represented. This is what understood as map scale. It is thus ; map scale defined as the constant relationship between the shorter lengths on the map and larger ground distances represented.
Or
The ratio of distance between the map and the actual ground represented and the fundamental application for this is as follows:-
|
Map scale = Map distance
Ground distance |
CATEGORIES OF MAP SCALES
Scales of maps are not all the same. They are extremely varied in size, expression methods and units of corresponding distance expression. It is thus; map scale are classified according to such terms of variation.
MAP SCALES ACCORDING TO SIZE.
Large scale :-
It is a type of scale which gives larger representation on a map and permits limited details to appear.
Small scale:-
This makes smaller representation of very wider part of the earth’s surface on a map permit limited details to appear.
Medium scale:-
This provides a medium representation of a part of the earth’s surface on a map and permits details in moderate level to appear.
There is no general agreement of the quantitative limits of the terms, small, large and medium scales. However most of the cartographers agree that:-
- A map with reduction ratio 1;50,000 or less would be large e.g. 1:25,000
- A map with reduction ratio of 1:500,000 or more is considered as small scale e.g. 1:1,000,000.
- A map with reduction ratio of in between of the two above, considered medium scale. E. g. 1:200,000.
Scales according to the forms of expression.
It is widely considered on how a scale has been indicated on the map. This generates three types of scales and include the following.
Statement scale.
This is also known as verbal scale. It is considerably to a scale that is expressed on a map by being stated in words. E.g. 1 cm on a map represents 1 km on the ground.
Representative fraction scale:-
It is considerably to a expressed on a map in ratio or fraction with numerator and denominator appearing in a similar smaller unit e.g. 1:50,000
Linear scale.
This shows the ratio of distance between the map and ground along the line.

Map scales according to expression units used
Scale according to this consideration, broadly categorized into two and include the following.
Metric scale.
It is a scale system in which the units of expression for the corresponding distances between the map and ground are of metric e. e. 1 cm represents 5km.
Imperial scale:-
It is scale system in which the units of the corresponding distances between the map and ground are of imperial. E.g. 1 inbch represents 2.5 miles.
SCALE SIZE OF MAPS
Scale size varies considerably from map to maps as some drawn on large scale, while others may be drawn on medium or small scale. Variation in map scale size is made by some determinant factors.
The main determinant factors for map scale size include:-
- Size of the ground represented by the map
- The size of the map drawn
- Amount of the ground details shown on the map
Size of the ground represented.
Maps which represent varied grounds in size differ in scale size. Smaller ground is made have larger representation on a map and thus; the map is subjected to have large scale. Conversely; wider area is made to have smaller representation and thus; the map subjected to small scale.
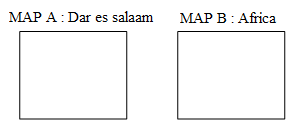
Map A; is of large scale as the represented area is smaller in size; while map B is of small scale as much wider area represented.
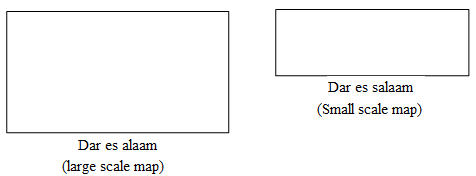
2. Size of the map.
Maps of varies size differ in scale size. A map of large size makes large representation of an area and thus, subjected to large scale size. Conversely to a map of small size makes smaller representation of an area and thus; subjected to small scale.
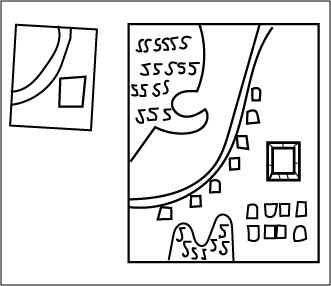
3. Amount of details.
This controls scale size indirectly. Maps constructed to show varied levels of details differ in scale size. A map that planned to show few details is designed to be of small size and thus, subjected to small scale as makes smaller representation. Conversely; a map planes to show numerous details is designed to be of large size and thus subjected to large scale as makes larger representation.
METHODS OF SHOWING SCALE ON MAPS.
On a map, scale can be represented by one or more of the following useful methods.
- Statement scale.
- Representative fraction scale (RF Scale)
- Linear scale
(a)Statement scale.
This shows the relationship of distance between the map and the actual ground represented by being stated in words. E.g. one centimeter on a map represents one kilometer on the ground; 1 cm represents 1 km; or 1 cm to 1km.
Statement scale is also known as verbal scale.
Properties of statement scale.
- The scale on the map is expressed by being stated in words.
- Map distance is given in smaller unit of like centimeter and inch; while, the ground distance given in larger units of meter, feet, kilometers and miles, But it has to be noted that, cm corresponds to meters and kilometers to give metric statement scale, while inch goes corresponds to feet and miles to give imperial statement scale.
· The amount of map distance in the scale is always 1.
(b)Representative fraction scale.
It is a form of scale expression in which the relationship of distance is given in ratio or fraction. It is established with special emphasize of showing the relationship of distance in similar unit. E.g. 1:50,000
![]() Or 1
Or 1
50,000
Properties of RF Scale.
· The scale is expressed in ratio fraction with numerator and denominator.
· The numerator stands stands for map distance; while the denominator stands for ground distance.
· The numerator and denominator treated in similar smaller units.
· The amount of numerator is 1. For instance; scale should not be expressed as 2:50,000; instead it should be 1:25,000.
· It is neutral to metric and imperial scales.
(c)Linear scale.
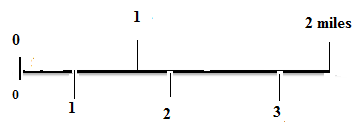
Linear scale is alternatively known as graph plain bar, divided and open scale. It is a form of scale expression in which the line on the map shows the relation ship of distance between the map and ground represented.
Categories of linear scales.
Linear scales are not all the same. They are extremely varied in appearance and nature of the measurement units used. Thus, linear scales are categorized in basis of the appearance and measurement units used.
According to the form of appearance; linear scales are categorized into two and include:
- Long linear scale.
It is a linear scale system commonly used to obtain direct accurate ground measurements especially of distance from the topographical map. It is very common on large scaled maps.

- Short linear scale.
It is a linear scale system which gives a general idea on the relationship of distance between the map and actual ground represented.

According to the nature of the measurement units used, linear scales categorized into three types. These include the following:-
Metric linear scale.
It is linear scale system which uses metric units to express the relationship of distance between the map and actual ground represented.

Imperial linear scale.
It is linear scale system which uses imperial units to show the relationship of distance between the map and actual ground represented.

Double linear scale.
It is linear scale system with both metric and imperial units. Commonly on top metric or imperial units. Commonly on top metric or imperial measurements may appear, and at below the measurements in imperial or metric units may appear.
Properties of linear scale
- The relationship of distance between the map and ground expressed a long a line.
- The line scale is divided into equal parts, and each part shows the ground distance in regular interval.
- Most of the linear scales have two major portions of primary and secondary sections.

- The primary section is larger and placed at the right hand side of the line scale . This shows larger ground distances commonly known as primaries, and given in larger units of kilometers along the metric scale, and miles along the imperial linear scale.
- The secondary section is smaller and placed at left of the line scale. This section is divided into fractions to show smaller ground distances known as secondary’s. These given in smaller units of merits along the metric scale, and feet along the imperial linear scale.
Note:-
Along the imperial linear scale, the larger measurements of miles indicated a long the top of the line scale; while the smaller measurements indicated along the bottom of the line scale.
DRAWING OF THE LINEAR SCALE.
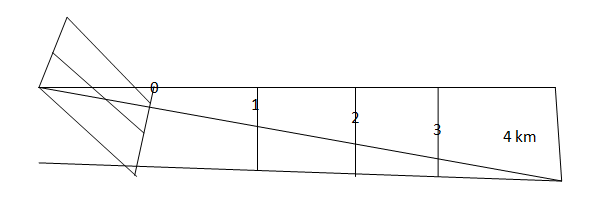
The drawing of a linear scale should involves the following fundamental steps.
(i) take into consideration on the relationship of distance between the map and the actual ground represented. Assume the scale is 1 cm represents 0.5 km.
(ii) Determination (consideration) of the unit length for the linear scale drawing. It is principle for the unit length amount should measure ground distance of the whole number.
E.g.
As 1cm = 0.5 km.
X = 1km?
1cm x 1 km = 1cm
0.5 km 0.5
Hence; 2cm measure 1 km along line
(iii) Draw the line to have length that evenly divided by the amount of unit length. The length. The length of the line determined by the space of the map and sometimes by the recommended ground distance to be measured along the line scale.
(iv) Dived the line scale into major portions of priary and secondary sections. Allocate 0 to separate the two sections.
(v) Sub divided the primary section into equal larger segments with respects to the amount of unit length determined.
(vi) Subdivide the secondary section into 10 smaller fractions. The length of each smaller fraction is determined by taking the amount of unit length divided by the number of smaller fractions required.
2cm = 0.2cm
10
Hence; each smaller fraction = 0.2 cm (2mm).
(vii) The segments along the primary section and the smaller fractions along the secondary section should be proved if are accurate. It is by drawing the line of the 200 – 400 from 0 or from the left of the line towards the end of primary section. Similarly, measure the same angle from last point of primary section. Divide the angle lines into similar segments to those of base line and join the points of the three lines.
To the secondary section, draw the line of 900 downwards and upwards at last parts and they should be divided into 10 smaller units.
(viii) Finish by indicating the numbers and the used RF scale or statement scale.
SCALE CONVERSION.
Scale conversion is a cartographic process of changing map scale from one form of expression into another. The cases may include the following:-
· Statement scale into scale
· RF scale into statement scale
· Linear scale into statement scale or RF scale
Statement scale into RF scale:-
Examples:
(i) 1 cm to 0.5 km.
The RF scale from the given statement scale above is determined as follows:-
· Recall 1 km = 100,000 cm
· Then
If 1 km = 100,000
0.5 km = ?
0.5km x 100,000cm = 50,000
1km
Thus,the RF scale = 1:50,000
(ii) 1cm to 0.75km.
The RF scale from the given statement scale above is determined as follows.
Recall 1km = 100,000cm
Then
if 1km = 100,000
0.75km = ?
0.75km x 100,000cm = 75,000
1
Thus,the RF scale is 1:75,000
RF scale into statement scale
Examples
(i) 1:25,000
The statement scale from above RF scale is determined as follows
Recall 1km =100,000cm
Then;
if 1km = 100,000cm
? = 25,000cm
1km x 25,000 = 25,000 = 1
100,000cm 100,000 4
Thus;the scale is stated as 1cm represent 0.25km
(ii)1:250,000
The statement scale from the above RF scale is determined as follows.
Recall 1km =100,000cm
Then;
if 1km = 100,000cm
? = 25,000cm
1km x 250,000cm = 2.5km
100,000cm
Thus; the scale is stated as stated as 1 cm represents 2.5km
Linear scale into statement and RF scale
Linear scale can be converted into statement scale or RF scale or RF scale by considering the unit leghth used to construct it. The unit leght is realized by measuring the length of a segment with a ruler.

According to the given linear scale above; the used unit length is; 2cm measure 3km.
Then;
As 2cms = 3km
1 cm = ?
1cm x 3km = 3km = 1.5 km
2cm 2
Thus; the scale is state as; 1cm represents 1.5km.From the statement scale; The RF scale becomes; 1:150,000
IMPORTANCE OF SCALE.
Scale is useful in two varied way of map reading and interpretation;and making.
In map reading and interpretation.
- Enables the map user to understand the relationship of distance between the map and the actual ground represented.
- It is useful in understanding the relative size of the area mapped by considering the used scale size. For instance; if the used scale size is assessed large, it implies the used scale size is assessed small, larger area represented’
- It is very useful in making area size, distance and gradient determination of the geographical features which appear on a map and on the actual area.
- It is useful to judge the amount of the details of an area represented by taking into consideration of the scale size used. For instance; if the used scale is assessed large, it implies, the map makes larger representation of the small area and it is possible for many details about the area to have been included on the map.
In map making.
- Determines the size of the map to be constructed
- Controls the amount of details to appear on the map relatively to the size used
- It is very useful in the cartographic process of map reduction and enlargement
- Controls the size of the convention symbols, sign and abbreviations
- It is useful in making map projection
- Controls or determines the size of the ground to be mapped
EXERCISE
Q. A racing motorist travels at a speed of 120km/hr covered a ground distance measured on the map by 6cms. If traveled for 15 minutes. Determine the RF and statement scales (NECTA 1984).
Q. A racing cyclist covers a distance of 45 km between town A and b in 30 minutes. If the distance measures 3 cm on the map.
(i) Calculate the speed of the cyclist
(ii) For how long will cover 120km
(iii) Draw a linear scale to read 120 km (NECTA 2002)
Q (a) (i) Define a scale of a map
(ii) How important is a scale of a map to map user?
(b) (i) Given 1:50,000 state the scale into centimeters to a kilometers
(ii) Given – 1cm on a map represents 4 kilometers on the ground. Express this scale as representative fraction (RF Scale) (NECTA 1996)
Q. (i) Why are scale necessary in map making?
(ii) Construct a metric linear scale for 1:30,000 to measure 1.6 km (NECTA 1983)
Q. By comparing a 1;25,000 and 1;50,000 map scales, show the usefulness of scales in map reading and interpretation (NECTA 1995)
Q. (i) convert the scale of the map to a unit lenghth of one kilometer of the linear scale.
(ii) Construct the linear scale by using the RF Scale of 1:30,000 and indicate a distance of 3.6 km (EZEB 2006)
Q. A bus driver traveling along Arusha – Babati road covering a distance of 10 cms on a map in 30 minutes, if the speed of the bus was 50km/hr.
(i) Calculate the distance covered in km
(ii) Find its statements scale
(iii) Draw a liner scale using the above statement scale (NECTA 2000)
Q. Mention two uses of the representative fraction scale (NECTA 1988)
Q (a) Differentiate between large and small map scales
(b) outline the determinant factors for map scale size
(MOCK Q.)
Q. (a) Explain why scales are necessary in map making
(b) By using the unit length of 1 cm to measure 3 km; construct a linear scale to read a distance of 8.2 kilometers.
(MOCK Qn.)
Q. (a) Differentiate between small and large scale maps.
(b) Show the potential significance of scales in cartographic process. (MOCK Q.)
6.2 DETERMINE DIRECTIONS AND AREA
DISTANCE AND SIZE AREA MEASUREMENTS
Topographical maps can be potentially used to asses the measurements of the geographical features observed with reflection to the respective actual areas represented. It is therefore important to learn how the measurements of the geographical features of represented areas can be established from the topographical maps.
The popular ground measurements which can be established from the topographical maps are of distance and size of different land structure.
DISTANCE DETERMINATION
Distance is defined as the length of an elongated object or space between the two points on the earth’s surface expressed in units of linear measurements like; meters, feet, kilometers and miles.
Distance measurements of any elongated object on the topographical map has to take into consideration of the following key issues.
- · Map scale; The ratio of distance between the map and the actual ground represented. This enables the change of convention distance (CD) into actual ground distance.
- · The appearance of the elongated object on the topographical map given whose distance is to be measured. This determines the technique to be applied to get the CD.
Distance determination
For straight elongated objects.
For straight elongated objects,one has to use a ruler more directly to get the conventional distance of the object on the map. i.e. a ruler has to be placed along the elongated object to be measured.

The distance of the road from above is determined as follows:-
· Map scale:- CD of the road = 8 cm
If 1cm represent 0.25 km
8cm represents ?
8cm x 0.25km = 2km
1cm
Thus, the distance of the roads is about 2km.
Distance measurements for the curved elongated objects.
It becomes more difficult to obtain the conventional distance for the curved elongated object with the use of a ruler directly from the topographical map. Up on this challenge and others, one has to resort the use of the following enhancing tools to get the conventional distance of what required to be established. The enhancing tools include the following:-
- A pair of divider
- A piece of paper
- A piece of thread
1. The use of a pair of divider
A pair of divider up on its nature is commonly used to measure short straight courses between points a long the elongated object. To make this, one has to do the following.
- Identify the two recommended points of the elongated object on the topographical map given. The points can be identified by considering the given grid references, place names. Sometimes, both grid references and place names and can be considered.
- Divide the elongated object on the topographical map into convenient short straight sections.
- Open your divider and measure the straight divisions (courses) along the recommended elongated object.
- Add up all the measures to get total convectional distance of the elongated object.
- The obtained convectional distance should be converted into the actual ground distance with respect to map scale provided.
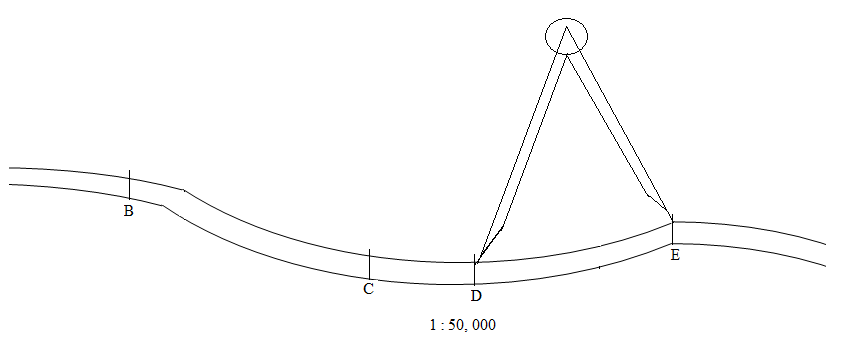
The distance of the road above is obtained as follows:-
AB=1cm; BC = 1.5cm; CD = 0.5; DE = 2cm; EF = 2cm
· The total CD = 7 cm
· Map scale, 1 cm represents 0.5 km
Then;
If 1cm represent 0.5km
7 cm represent ?
7cms x 0.5km = 3.5 km
1 cm
Thus ; distance of the road is of about 3.5 km
2. The use of a piece of paper.
A piece of paper can be used to measure either a short or long distances.
Procedure;
- Take a piece of paper and fold it.
- Put the piece of paper on the map and measure each small distance along the route.
- Take the piece of paper to the linear scale on the map to have ground distance
Example;
The distance of the road below can be determined as follows:-

Distance determination with the use of a piece of paper is up on the following application:-

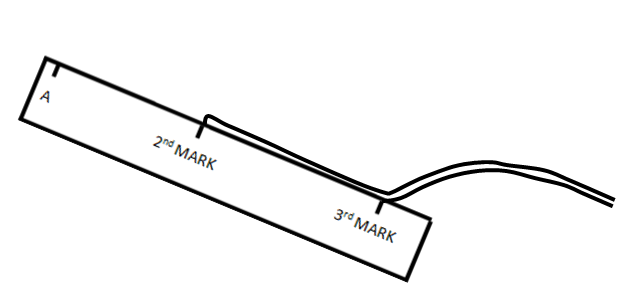
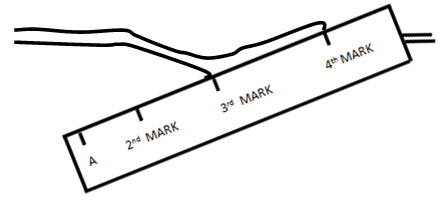


Thus; the distance of the road according to the application above is of about 4.5 km.
3. The use of a thread.
Procedure:-
- Identify the two recommended end points of the elongated object whose distance is to be measured on the map. The two ends can be identified by taking into consideration of grid references, place names or both.
- Take the thread and spread it along the elongated object from one end to another.
- Take the thread to a ruler to measure the conventional distance of the elongated object.
- Convert the conventional distance into ground distance with respect to map scale indicated on the map.
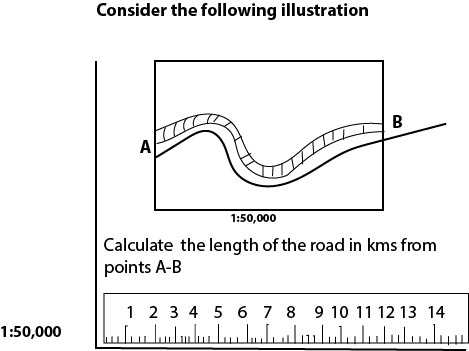
The length of the road from A to B is determined as follows.
- Map scale; 1 cm represents 0.5 km
- CD of the road = 11 cm
THEN;
If 1 cm = 0.5 km
11 cm = ?
11cm x 0.5 km = 5.5 km
I cm
Thus; the distance of the road is of about 5.5km
AREA SIZE DETERMINATION.
Area size refers to a bigness or extent of coverage of any part of the earth’s surface expressed in square unit of measurements. For instance; the bigness of a water body, plantation, forestland, country and others of the same consideration.
Area size determination of any thing from the topographical map should take into consideration of the following two keys issues.
- Map scale; The ratio of distance between the map and the actual ground represented. This enables to change of conventional measurements obtained on the topographical map into actual ground measurements.
- The shape of the feature on the topographical map given whose area size is to be measured whether regular or irregular. This determines the method to be used to get the size.
Area size determination for regular features.
Regular features are those whose appearance well defined. They include; triangle, rectangles, square, circle, trapeze, octogon and others of the same reflection. To calculate the size of these regular figures, some one has to apply a relevant mathematical application with respect to the shape of the features observed on the topographical map.
Consider the following:-
(a) Triangle.
Consider the following illustration.
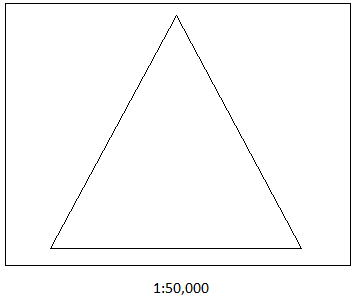
The size of the area occupied by forest is calculated as follows:-
So long the forest land occupied the shape of a triangle, the relevant formula is as follows:-
| Area size = 1/2 x base x height |
*Map scale; 1cm represents 0.5 km
*According to the measurements of the feature on the map.
· Base = 6 cms
· Heigh t = 14 cms
Then;
½ x (6 x 0.5 km) x (14 x 0.5 km)
½ x 3km x 7km
21 = 10.5
2
Thus; the area size of the forestland is of about 10.5 km2
(b) Rectangle;-
Consider the following.
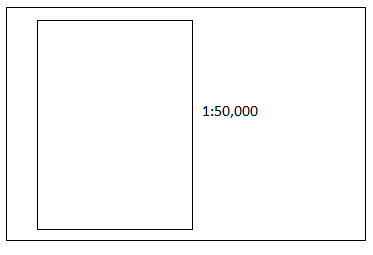
The size of the area occupied by forest from the given topographical map is determined by the following application.
So long, the forestland occupies the regular shape of a rectangle, the relevant formula is given as follows:-
| Area size = width x length |
*Map scale; 1cm represents 0.5 km.
*According to measurements of the figure on the map,
*According to measurements of the figure on the map
- Width = 4 cm
- Length = 8cm
4 cm x 8 cm
(4 x 0.5 km) x (8 x 0.5 km)
2 km x 4 km = 8km2
Thus; the area of the forestland is of about 8km2
NOTE:
The two given above represent the other regular figures. It is therefore important for the students to be knowledgeable to relevant mathematical applications for calculating the size of the other regular figures up on observation on the topographical map.
Area size measurement for the irregular figures.
To determine size for the irregular features observed on the topographical maps, some onbe may resort the use of the following methods.
- Grid square method
- Stripping method
- Geometric method
The grid square method.
It is the most popular and widely used method of determining area for irregular figures observed on the topographical map with reflection to actual areas represented. It is mostly used, if the given map observed to have the vertical and horizontal grid lines on its face forming so perfect square as cross each other at right angles.
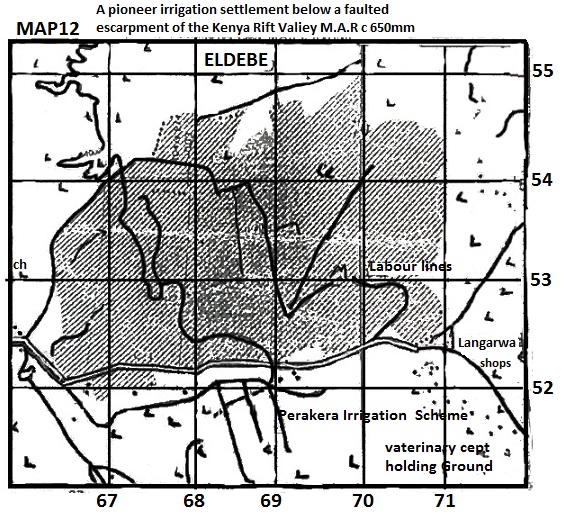
From above, the area size of the coffee plantation is calculated follows:-
* Map scale ……………… 1cm represents 0.5 km
*Method ………………… grid squares consideration
* Actual size of the ground by each grid square determination.
| Area size = width x length |
According to the grid squares on the given map;
- Width = 2cm
- Length = 2cm
2 cm
2 cm
Then;
· 2cm x 2cm
(2 x 0.5 km) x (2 x 0.5km)
1km x 1km = 1 km2
Hence; Grid sguare = 1 km2
Complete squares = 3
3 x 1 km2 = 3 km2
Incomplete squares = 11/2 = 5.5
* 5.5 x 1 km2 = 8.5 km2
Thus; the area size of the recommended feature is of about 8.5 km2.
Stripping method
By this method, part of the topographical map with reflection to the ground represented under consideration is divided into a number of convenient strips. It has to be followed by finding out the area size of each strip and have to be all added to get the entire area size of the feature.
Consider the following illustration:-

The area size of the lake is obtained as follows:-
*Map scale 1cm represents 0.5
- Strip A: 8cm x 1cm
(8 x 0.5 km) x (1 x 0.5 km)
4km x 0.5 km = 2km2
- Strip B: 10 cm x 1 cm
(10 x 0.5 km) x (1 x 0.5km)
(10 x 0.5 km) x 0.5 km = 2.5 km2
5km x 0.5 km = 2.5 km2
- Strip C: 8cm x 1cm
(8×0.5 km) x (1 x 0.5 = 2 km2) = 2 km2
- Strip D: 9cm x 1cm
(9×0.5 km) x 0.5km = 2.25km2
4.5km x 0.5km = 225km2
- Strip E; 8cm x 1cm
(8 x 0.5 km) x (1 x 0.5 km)
4km x 0.5km = 2km2
Then;
2km2 = 2.5km2 + 2km2 + 2km2 + 2.25km2 + 2 km2 = 10.75km2
Thus; the area size is of about 10.75km2
Thus; the area size of about 10.75km2
Geometric method.
It is by dividing the boundary area of the feature into a convenient number of mathematical (geometric) figures of like rectangles, triangles or combination of these figures on\over the same. It should be followed by calculating the area size of the forced geometric figures with respect to the used scale. At last the distinctive size should be added to get the entire area size of the feature.
Consider the following illustration;-
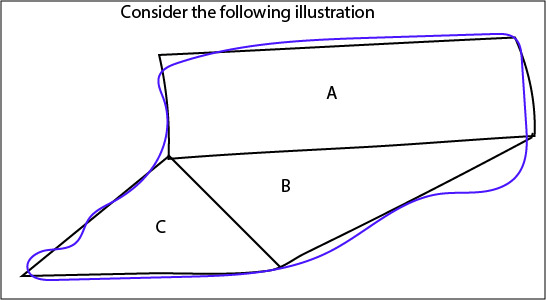
*Map scale …………… 1 cm represents 0.5 km
Rectangle A
| Area size = width x length |
8cm x 18 cm
(8 x 0.5 km) x (18 x 0.5 km)
4 km x 9 km = 36 km2
Triangle B
| Area size = ½ x base x height |
½ x 18cm x 10cm
½ x (18 x 0.5 km) x (10 x 0.5 km)
½ x 9km x 5km
½ x 45 km = 22 .5 km2
Triangle C:-
| Area size = ½ x base x height |
½ x 16cm x 6cm
½ x (16 x 0.5km) x (6X0.5km)
½ x 8km x km
½ x 24km = 12km2
Then; 36km2 + 22.5 km2 + 12km2 = 70.5 km2
Thus; the area size is of about 70.5km2
EXERCISE
Qn. What is the length of the all weather road with loose surface from Grid 930352 to Grid 040339 in kilometers.
(NECTA 1999 —– Extract map Babati……….. Series Y 742)
Qn. Measure the lenghth of the major road from grd reference 886220 to grid reference 975192. Give your answer in kilometers. (NECTA 2004 —– Extract nmap of Mwanza sheer no. 33/2)
Qn. Calculate the area covered by forest in square kilometers.
(Necta 2009 —– extract map of MPWAPWA sheet no 163/4)
Qn. Calculate the area of kisangara estate in square kilometers
(EZEB —– 2009……. Extract map of Kisangara sheet no 73/1)
Qn. Calculate the area covered by plantation agriculture in square kilometers (NECTA 1999 —- Extract map Babati …… Series Y 742).
Qn. Find the actual distance of railway line from grid reference 860975 to 930039 in kilometers.
(NECTA 2006—– Extract map of Mpanda —– sheer no 153/3)
Qn; Calculate the area of Weru sisal estate. (NECTA 1997 – Extract map of Moshi —– series Y 742)
Qn. Measure the distance of the Moshi – mweka road all weather loose surface road (grid 154309 to 135400) (NECTA 1997 – Extract map of Moshi —– series Y 742)
Qn. What is the total area covered by the lake in square km?
Qn. Calculate the area of lake balangida gidaghangaat and give your answer in square kilometers. (NECTA 1998 —–Extra map of hanang — series Y 742)
Qn. Find the total area of the land of this Island found to the west of Easting 180 if the scale of the map to duced y half (DSM – Mock AN 2003—– Extract map Nansio Island sheet 22/1)
Qn. Calculate the area of seasonal swap, south of nothing 080 and west of easting 690. Give your answer is square km.. (JICA —- 2009) – Extract map of utete)
MAP REDUCTION AND ENLARGEMENT.
The cartographic processes of minimizing and expanding the size of any map understood as map reduction and enlargement respectively.
MAP REDUCTION
As it has been pre described, map reduction is a cartographic process of minimizing the size of a map to provide smaller representation of the area.
To reduce the map the following as rules should be followed:-
- All sides of the map i.e. the length and width should be reduced with the same number of times.
- All drawings on the map should be reduced with the same number of times.
- The scale has to be changed to become a comparatively smaller in order for it with respect to map to give the same ground measurement as the old map does.
- The map has to be redrawn by using the reduction measurements.
- Insert the details on the reduced map according to new reduction measurements. The transfer of details should take into consideration of the grid pattens, and if possible for making more accuracy, the diagonal lines can be drawn the grid squares.
Note:
The conventional symbols, signs and abbreviations should be reasonably small in order for them to fit onto the size of reduced map.
Impacts of map reduction.
- The map size becomes smaller and thus gives smaller representation of the area mapped.
- The map would become less detailed as it more selective due to the limitation of the map’s space.
- The cartographic symbols, signs and abbreviation appear smaller.
- The scale of the map becomes comparatively smaller.
Consider the given map and reduce it by ½
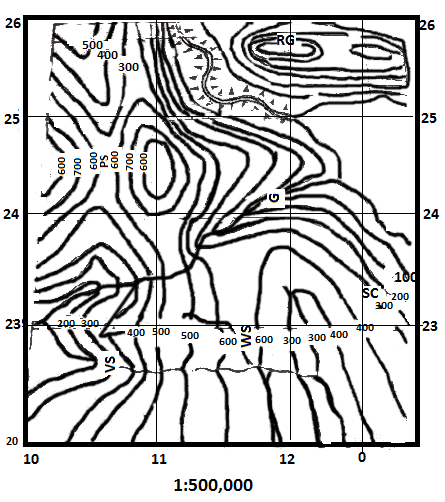
Procedure.
(i) Consideration of the given map by studying it clearly.
(ii) Determination of the amount of reduction reduction factor is by ½
(iii) reduction of the map length
- Length on the old map = 8cm
8 x 0.5 = 4cm
Hence;the new length = 4cm
(iv)reduction of the map width
- width on the old map = 8cm
8 x 0.5 = 4cm
Hence;the new length = 4cm
(v) Reduction of the grid squares
- Grid square on the old map = 2cm
2cm x 0.5 = 1 cm
Hence; the new grid square = 1 cm
(vi) Determination of the new scale
| New scale = reduction factor x old scale |
½ x 1/50,000 = 1/100,000
Hence; the new scale = 1: 100,000
Alternatively the new scale can be determined by the following application
| Map scale = Map distance
Ground distance |
* 3cm = 1 cm to km
3 km
Or
4 cm = 1cm to 1 km
4km
Thus; the reduced map appears as follows:-
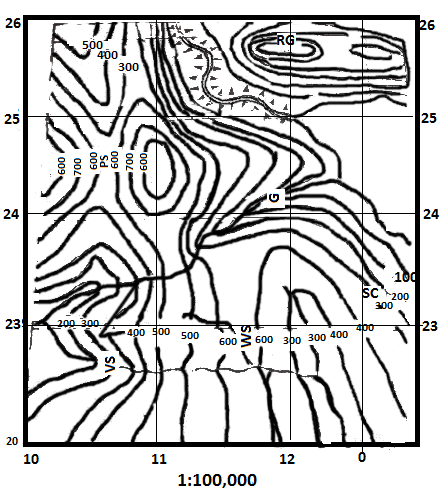
MAP ENLARGEMENT
It is a cartographic process of expanding the size of a map to provide larger representation of the mapped area.
To enlarge a map the following as rules should be followed:-
- All sides of the map, i.e. length and width should be enlarged with the same number of times.
- All drawings on the map should be enlarged with the same number of times.
- The scale has to be changed to become comparatively large in order for it with respect to the map to give the some ground measurements as the old map does.
- The map has to be redrawn by using the enlargement measurements.
- Insert the details. The transfer of details should take into consideration of the grid pattens, and if possible for making mre accuracy, the diagonal lines can be drawn across the grid squares.
Note
The conventional symbols signs and abbreviations or initial should be reasonably large in order for them to fit onto the enlarged map.
Impacts of enlargement.
- The map size become larger and thus, gives larger representation of the mapped area.
- The map is likely to be more detailed as it is less selective due to the larger space of the map.
- The cartographic symbols, signs and abbreviations may appear larger in size.
- The scale becomes comparatively larger.
Consider the given map below and it enlarge by 2.
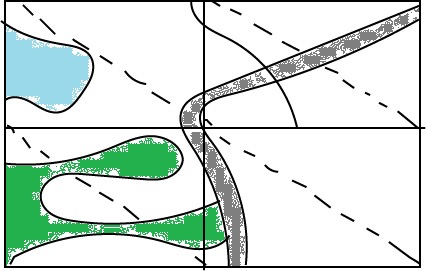
1:50,000
Procedure
(i) Consideration of the given map studying it Clearly.
(ii) determine of the amount of enlargement. Enlargement is by 2.
(iii) Enlargement of the map length.
- Length on the old map = 4cm
4cm x 2 = 8cm
Hence ; the new length = 8cm
(iv)Enlargement of the map width
- width on the old map = 4cm
4cm x 2 = 8cm
Hence;the new width = 8cm
(v) Enlargement of the grid square.
- Grid square on the old map = 2cm
2cm x 2 = 4cm
Hence, the grid square = 4cm
(vi) Determination of the new scale
| New scale = enlargement factor x old scale |
2 x 1/50,000 = 2/50,000 = 1/25,000
Hence; the new scale = 1:25,000
1:25,000
Alternatively the new scale can be determined by the following application.
Map scale = Map distance
Ground distance
8cm = 1cm to 0.25cm
2km
Qn. (a) Outlining your steps redraw provided (1:50,000) to a scale of 1:100,000 and indicate the following features:-
The forest area, Songoro and chimumbu hills, lake Duluti, Nkoaranga hospital and all weather road bound surface.
(b) Examine the two maps and comment on the impact the change of the map scale has on the map area and its contents.
(DSM – MOCK, 2002:Extract map of TENGERU: (sheet No./ 55/4Ed)
Qn. (a) Calculate the approximate area in square kilometers of the contoured map if its scale changed to 1:100,000 (NECTA 2001, Extract map of Kondoa – sheet # 104/4)
Qn. Redraw the map north of northing 120 and west of easting 650 by the scale of 1:25,000 and on it indicate woodland and seasonal swamp.
JICA ===2009) Extract map of ulete)
Qn. Draw a map of district found at the western part of the map by using the scale of 1:100,000 and on its show the following.
(i) Boundary of the district
(ii) Mwanza – Shinyanga road
(iii) usagara – Fela station road
(iv) Railway line
(v) Ngeleka hill, jijawenda hill and kagela hill
(vi) Out crop rock around jijawenda hill.
(vii) Bridges along Fela – Mwanza road (NECTA 2010)
6.3 MAP ORIENTATION
POSITION LOCATION ON TOPOGRAPHICAL MAPS
The position location of geographical features on topographical maps with reflection to actual areas represented can be established by employing one or more of the following methods:-
- Place naming
- The use of latitude and longitudes
- Grid reference
- Bearing and distance
(a) Place naming
By this, method names of places on the topographical maps and up on the earth’s surface can be used to give the position location of a point, feature or another place e.g. the Yanga Sports club head office is at Jangwani.
If place naming method is used for giving position location of any geographical feature on he topographical map and up on the respective actual area represented on the earth’s surf ace, should meets the following conditions:-
- The name of a place to be should be unambiguous i.e. some times more than one places may share the same name.
- The name to be located should be of of significance to a person.
NB: So long the place naming method is facing a problem of ambiguity, it can be dissolved supplementing it with another method of giving location like that of grid reference or direction. E.g. the school is at Ruvu, GR 432675.
(b) The use of latitude and longitude:
It is the most useful geographical method of giving position location on the map and up on the earth’s surface. These measurements are always needed in actual making of the accurate maps. Nearly all maps indicate these along their edge though not all show these in more detail.
Both, latitudes and longitudes are really angular distance measured accurately from the centre of the earth and are expressed in degrees and further divided into smaller measurement units of minutes and seconds.
Latitude is an angular distance measured northward and southward of the line)
Longitudes are the angular distances eastwards and westward of the prime meridian.
The latitudes and longitudes are commonly used to locate the position for the wider features on the small – scaled maps or atlas maps on which these established more detailed.
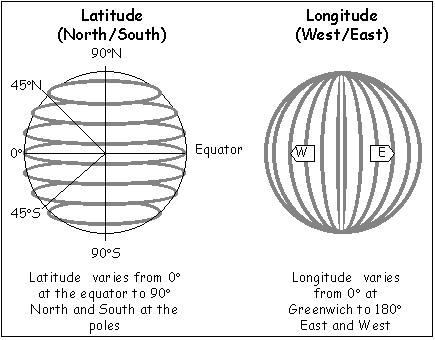
Procedure of giving latitudes and longitudes.
- Firstly establish the degrees of latitudes of a place where is located from one edge to another on the map
- Establish the degrees of longitudes of the place on the map from obne edge to another.
- Combine the degree reading of both latitudes and longitudes to give the proper position location of the place.
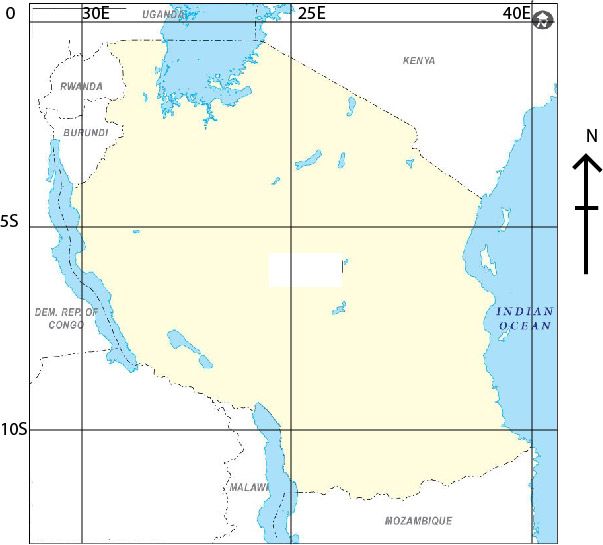
From above Tanzania located in Latitude and longitude position of 10 30’ sand 300 to 400 E.
(c) Grid reference:-
The use of latitudes and longitude becomes increasingly difficult for larger scaled maps. For this and others, map makers have devised a quicker and easier method known as grid reference.
A grid is a network of the evenly spaced vertical and horizontal lines drawn on the map face. The lines drawn perpendicular to one another and cross at right anglesand form the so perfect squares.
All vertical lines are called easting, because of being numbered eastwards, while the horizontal lines are numbered northwards referred to northing.
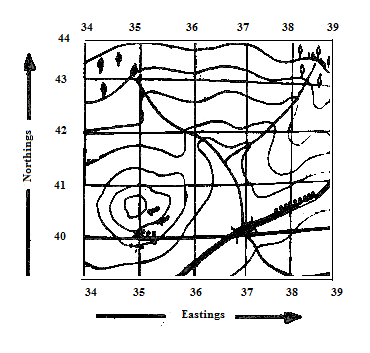
The establishment or reading of the grid reference, it has to start by producing the numbers of easting, and then those of northing.
Grid reference can be given in four figure numbers, if the position to be located is at the exactly intersection of the vertical and horizontal grid lines. It should be in six figure numbers, if the position to be located is not at the intersection of the vertical and horizontal grid lines. However; it is always much better for the grid reference be in six figure numbers regardless of the cases.
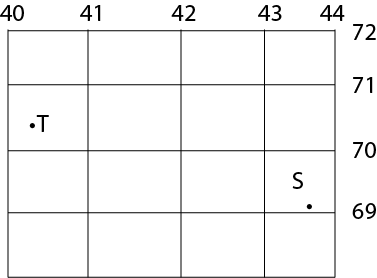
- Point T is located at GR 403705
- Point S is located at GR 437692
Note
The grid lines belong to maps. It is thus, have no reality on the ground. They do not even relate as do latitudes and longitude.
(d)Bearing and distance:
The method is mostly used to establish the location from another position by giving the degree angle measure clockwise from north and the distance of an observation line between the two positions.
Bearing is the degree angle of an observation line connecting two points on the map with reflection to an area on the earth’s surface measured clockwise from north direction.
Distance is the length of a space in between the two position points on the map with reflection to an actual area on the earth’s surface represented.
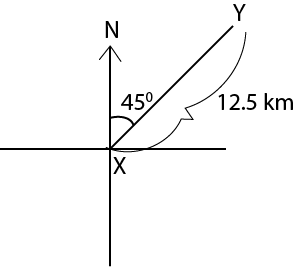
From the above; x is located at bearing and distance of 450 and 12.5 km respectively.
Example:-
Determine the location of point B from point A
Bearing determination
Procedure:
- Identify the two recommended points on the map by considering the grid reference or place names given. Some times both, grid reference and place names can be provided together.
- A straight line has to be drawn to join the two end points on the map. The line represents an observation sight between the two positions in the mapped area on the earth’s surface represented.
- Establish the four cardinal points at the position of observer. The establishment of the cardinal points should take into consideration of the north direction indicated on the map. On some of the topographical maps, the north direction is given by means of a true north.
- Take the protector and measure the angle of an observation line that connects two position points clockwise from north direction.
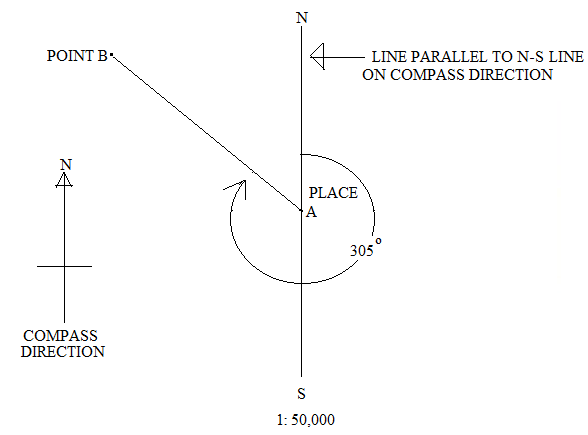
The bearing of point B from point A is of about 3050
Distance determination
Procedure
- Take into consideration of the map scale
- Measure the conventional distance (CD) of the observation line that connects the two points on the map.
- Convert the CD into AD with respect to map scale
- From above the CD = 10cm
Scale; 1cm represents 0.5 km
Then;
10 x 0.5 km = 5km
Thus; point B is located at bearing and distance of about 3050 and 5km respectively from point A.
Calculate the Bearing
Backwards bearing :–
It is the reverse of the bearing of an object taken in front of the observer’s position along the observation line is called forward bearing. While the bearing of an object measured clock- wise from north direction backwards to the former observer’s position along the same sight line is called backward bearing. It is thus, backwards bearing s defined as the degree angle of the object measured backwards to the former observers position.
Backward bearing of an object is obtained by measuring the degree angle of an observation line clockwise from north direction backwards to former observer’s position. This can be illustrated as follows:-
- Mark the four cardinal point at the observed object whose backward bearing to be established.
- Take a protector and measure the degree angle of an observation line clockwise from north direction
Example
The backwards bearing of point b from point A can be established as follows:-
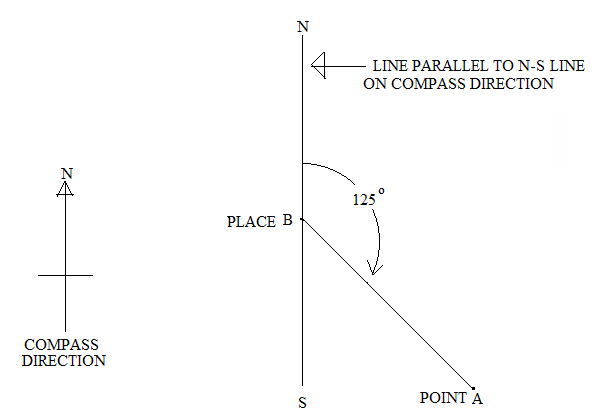
Thus; the backward bearing of point b from point A is of about 1250
Note
If the forward bearing of the object has been established, the backwards bearing can be determined by mathematical procedure.
| BB = FB + 1800 |
BB = FB + 1800 if the FB IS LESS THAN 1800
BB = FB – 1800 if the FB IS GREATER THAN 1800
From the above case
The FB = 3050
3050 (FB) > 1800
THUS ; The BB = 1250
Significance of the backward bearing
Backwards bearing is determined purposely to check the accuracy (correctness) of the forward bearing which has been taken in front of the observer’s position to an object along the sight line. It is checked by observation the difference in degrees between the BB and FB.
Always the standard difference should be 1800 if the difference is less or greater than 1800 the reading has been subjected to an error and thus needs correction to make proper determination.
Correction of errors
Correction of errors is attempted with the use of the mean error but considering the varied cases.
Mean error is computed by making the following application:-
| Mean error = Amount of error in degree
2 |
| Amount of error = The different between BB & FB – 1800 |
The correction of errors with the use of mean error is done by making the following applications:-
When BB > FB
| FB + Mean error BB – Mean error |
When BB < FB
| FB – Mean error & bb + Mean error |
DIRECTIONS
Direction means the course or a line along which a person or thing moves or locks or which must be taken to reach a destination.
Direction on the map can e given in four, eight or sixteen cardinal points of compass and their corresponding angular bearings.
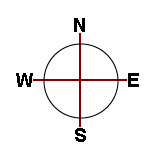
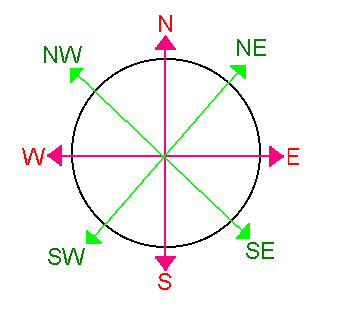
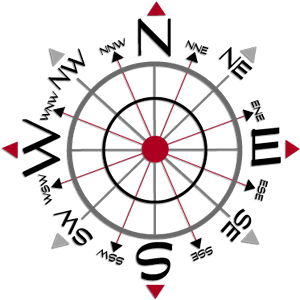
Note:-
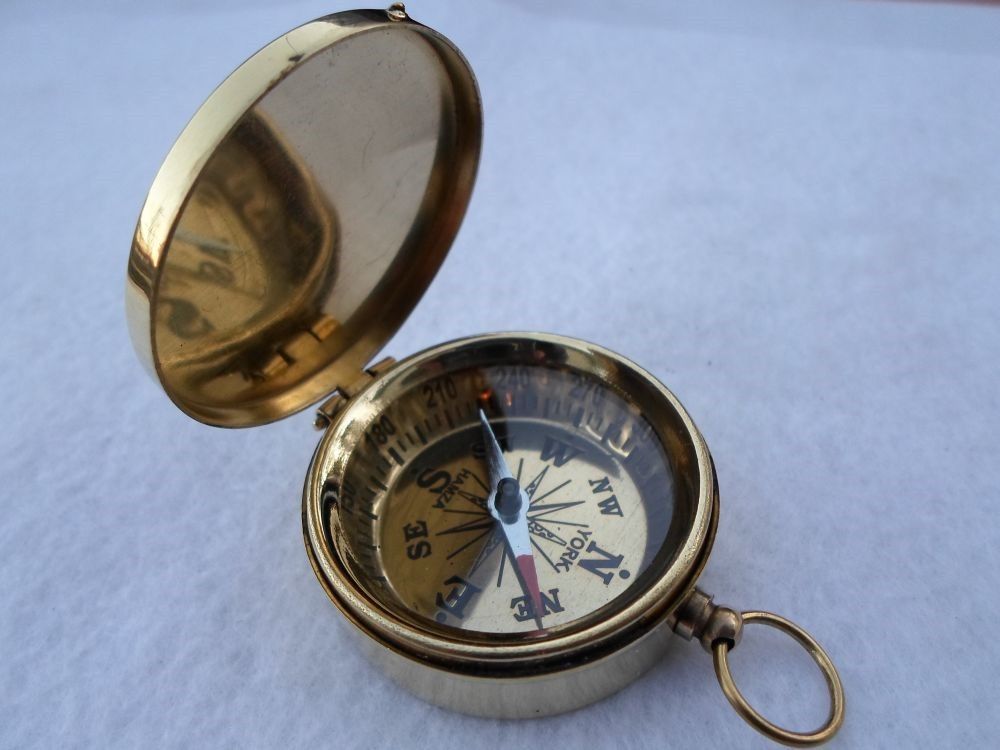
One land direction measured with the use of magnetic compass. The magnetic compass has a needle which always points to the north.
ALIGNMENT OF ELONGATED OBJECT.
Alignment is defined as a general direction and bearing of an elongated object on the map and up on the earth’s surface measured from the central position along the straight line. Elongated object can be of like that of a road, railway, ridge, coastline, river and others of the same nature.
Alignment is best described by stating both, direction and bearing E.g. the road aligns from 450 to 2250 (SW)
Steps involved in giving the alignment
- Identification of two end points on the topographical map given. The end points can be identified by taking into consideration of the grid reference or place names given.
- Drawing of the straight fine line using a ruler and pencil to join the two points.
- At the central point of the drawn line mark the four cardinal points.
- Take a protector and measure both degree angles in which the drawn straight line trends.
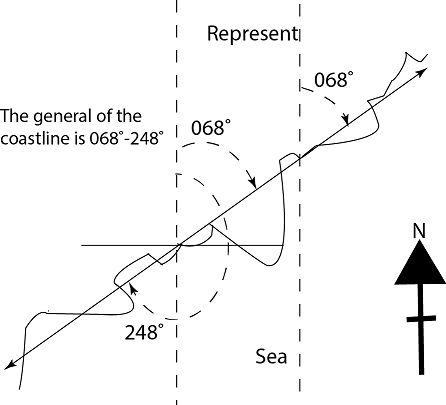
The alignment the coastline is from 0680 (ENE) to 2480 (WSW)
EXERCISE
Qn. Calculate the forward and backward bearing of Ryamugasire island grid 930340 from buhare home economics training centre grid 868324 (NECTA 2005 – Map extract of musoma sheet 12/2)
Qn. Calculate the forward and backward of Songea town at Grid reference 829169 (NECTA 2003 – Map extract of SONGEA sheet 299/1)
Qn. The compass bearing takes from a fishing boat to Samgoro hill and pump house Gr 045647 were 1450 and 1220 respectively.
Qn. By using grid reference write the position of the fishing boat.
Qn. Find the true bearing of the Samgoro from pump house (NECTA – 2002 the map of part of KENYA – NYAKWERE)
Qn. The compasses bearing of Lugongo and Kiamera hills were 1300 and 1490 respectively. These bearings were taken from a steamer on the lake.
Qn. Give the grid reference of the position of the steamer
(ii) Measure the distance in kilometers from the position of the steamer to Kaswanga pt :
(NECTA 1994-The map extract of Rusinga island)
Qn.An amateur surveyor recorded 87º as forward bearing from Goi Hill to Sangasanga hill, and 263 as his backward bearing.
(i) Correct the discrepancy of these readings.
(ii) State the importance backwards bearing.
(NECTA-2001, the map extract of KONDOA (sheet104/4.
Qn. Give the bearing of:
(i) The Masonic Lodge from Kibwesi
(ii) Tanzania packers factory from kiutu peak .
In each case, give the backward bearing.State the rule that enable you to check the correctness of your bearing (NECTA 1992 Extract, map of Arusha)
Qn. Determine the trend alignment of part from Raska zone grid reference 137417 to grid reference 148360 (NECTA – 2008 extract map of TANGA sheet 130/1)
Qn. Locate the position of Njoro school (NECTA 1997 – Extract map of Moshi Series y. 742)
Qn. (a) Find the trend of the major road from mwanza city to Musoma.
(b) Show the alignment of the railway line (NECTA 2004 – Extract map of Mwanza sheet # 33/2)
KINDS OF NORTH INDICATED ON TOPOGRAPHICAL MAP.
On most of the topographical maps, varied north are shown and these include rthe following:-
- Magnetic north (MN)
- True north (TN)
- Grid north (GN)
Magnetic north
Magnetic north is the one given by the line of half arrow head on the map representing the direction of magnetic pole (earth’s magnetic field) from the mapped area.
Magnetic pole is position of natural attraction of global magnetism
The direction of magnetic pole is detected by a needle of magnetic compass in the mapped area by the time of map construction. The needle of the magnetic compass points towards the direction where the global natural point of magnetism is located from the area to be mapped.
The north line on most of the African maps is not uprightly vertical . It is slightly vertical towards west as the global natural point of magnetism is located in America.
The natural point of global magnetism is found off the coast of Boothia peninsular, the north of Canada nearly price of Wales and In South is in Victoria land Antarctica.
However; the direction of magnetic pole shown on the map by magnetic north, is irregular as the natural attraction of magnetism is in water and the rate of change per year is noted.
True north
True north is the one given on the map as a star head line to represent the direction of global North pole (900 latitude) from the mapped area. It is parallel with the lines of longitudes.
The north pole is where all lines of longitudes meets. True north is the most useful north to geographic and it is mostly referred in the determination in position direction on the topographical map and up on the actual area represented.
The direction represented by true north does not change over the time because, the North pole is steadly constant in position.
Grid north
It is the unpointed north line given on the map, which follows the system of easting gridlines. This does not represent or show anything on the earth’s surface and that is why given by the un pointed line.
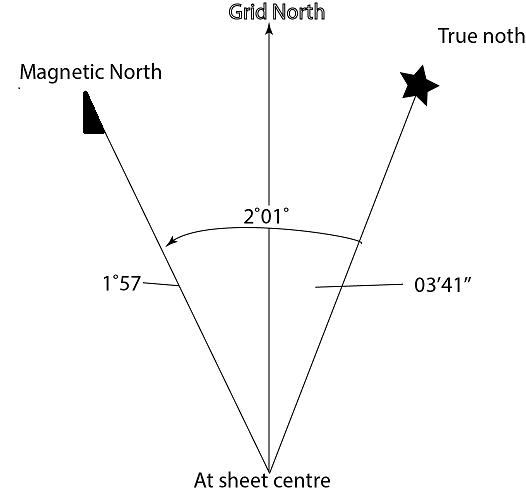
Magnetic variation:-
Magnetic variation is an angular distance in a place from the direction magnetic pole to the direction of north pole. i.e. the measured angular distance from true north to magnetic north on the map with reflection to the actual area represented.
Always the direction of magnetic pole as represented by magnetic north on the map changes, but does not coincide with the direction of north pole (true north) This makes a considerable angular distance in between of the two direction does not remain the same at the time due to the irregulaties of the magnetic field on the earth’s surface and thus, give to magnetic variation.
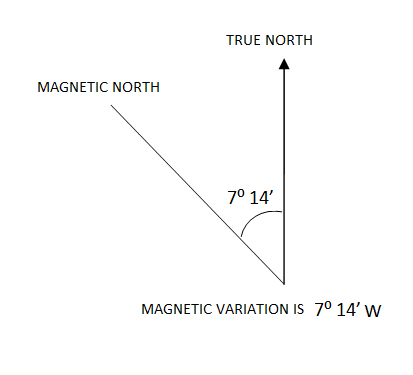
Magnetic variation is 70 14 W
Magnetic bearing:-
It is a degree angle of an observation line of a place to another place measured clockwise from the direction of magnetic pole. This is not rigid as the direction of magnetic pole is irregular.
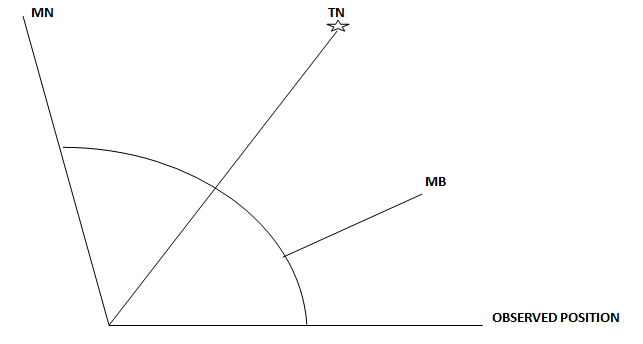
True bearing:-
It is a degree angle of an observation line of a place to another place measured clockwise from the direction of north pole. The angle on the map is measured clockwise from north pole towards the line of the observation. This is rigid as the direction of North pole from any place is steadily constant.
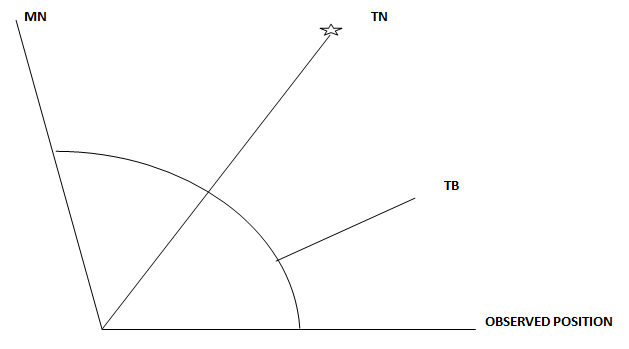
Magnetic variation projection:-
For some wishing to determine (project) magnetic variation of a place on the earth’s surface with reference to the previous one,has to make the following fundamental steps.
(1) Data analysis as per the details (content) available.With respect to this, the following should be recognized.
- The previous recorded magnetic variation.
- The date when the last magnetic variation has been recorded.
- The current date whose magnetic variation to be projected.
- The rate of change per certain given defined period of time like, year, month etc
2. Determination of the time interval by subtracting the old date from the new date.
i.e.
| Time interval = T2 – T1 |
3. Determination of the total change of magnetic variation by multiplying the rate of change with the determined time interval.
4. Get the new magnetic variation of the place by making addition or subtraction to the past magnetic variation. Addition is made if there is positive change: while, subtraction is made if there is negative change.
Exercise
Qn. Town Z had magnetic variation of 320 42 by march 1980, what was the new magnetic variation of the place by December 1990, if the rate of change is 10’ per annum positively.
Qn. Town X in west Africa had MB and TB of 450 23’12’’ and 250 34’57” respectively by January 1990. If the rate of change of the direction was 15’ per annum negatively, calculate the following by July 2005.
(i)Magnetic variation
(ii) True bearing
(iii) Magnetic bearing
Qn. (a) Differentiate between magnetic bearing and True bearing.
(b) Town X had magnetic variation of about 340 21”by November 1982. What was the new magnetic variation of the same town by February 1993, if rate of decrease stood at 15’
annually.
Qn. Differentiate between the magnetic north, True north and grid north (NECTA 1995)
Qn. (i) Define true bearing and magnetic bearing.
(ii) January 1945 the magnetic variation over town X.
Grid bearing
It is a degree angle of an observation line of a place to another place measured clockwise from the grid north.
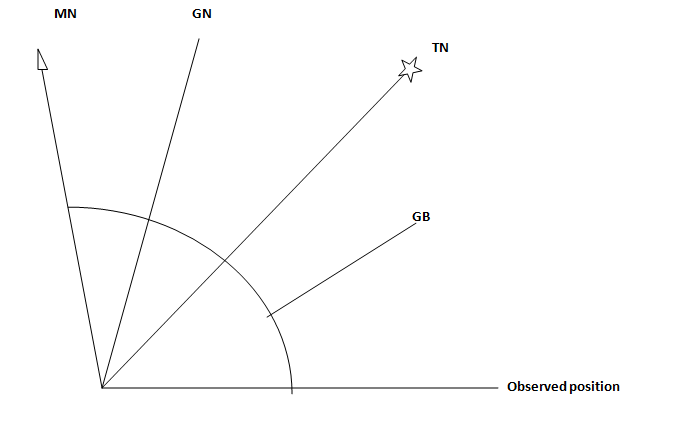
The conversation of magnetic bearing into true bearing
To convert magnetic bearing into true bearing, some one has to take into consideration of the direction of magnetic pole relatively to the direction of north pole.
- If the direction of magnetic ole is to west of north pole direction on the map and up on the earth’s surface, true bearing of the place is obtained by applying the following formula.
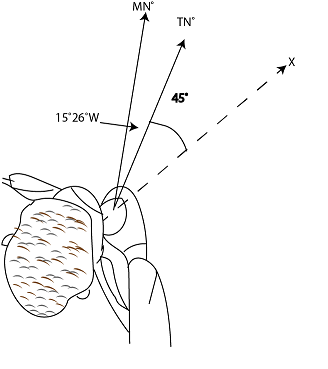
| TB=MB – MV |
450 – 150 26 = 290 34′
Hence: the TB is of about 29º 34’
While:
MB = TB + MV & MV= MB – TB
- If the direction of magnetic pole to east of the north pole direction on the map and up on the area represented, the true bearing is obtained by applying the following application.
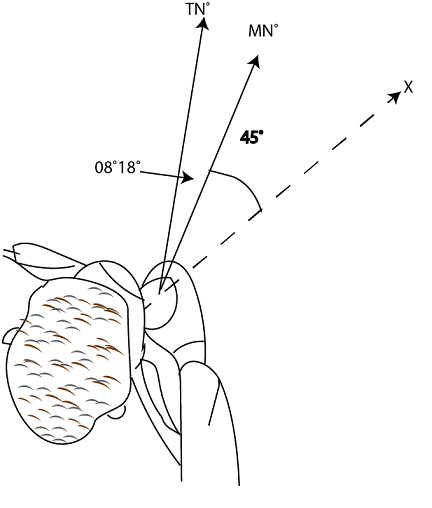
450 + 080 18’=53º18′
Hence,The TB is of about 53018′
While:
MB = TB – MV & MV = TB – MB
EXERCISE
Qn. 9’56 If the annual decrease rate stood at 5’Find the magnetic variation of the same town in October 1966 (NECTA 1989)
Qn. (a) Define true bearing and magnetic bearing
(b) The true bearing and magnetic bearing aver town by January 1990 were 530 42 and 58’21” respectively, What can be the projected magnetic variation over the same time by july 2010 if the rate of change wood at 15’E
Qn. (MOCK)
(a) (i) Define true north, grid north and magnetic north
(ii) Town Y had MB and TB of about 27036’ and 540 of 23” respectively by September 1982. Determine the MV. MB and TB of the same town as it was February 1993 if the rate of change stood 18’w.
6.4 UNDERSTANDING FEATURES ON MAPS
RELIEF REPRESENTATION ON MAPS
Relief refers to the physical appearance of an area by contrasting landforms. Or Variation in shapes and forms of an area over the earth’s surface.
The land forms which make the physical appearance of an area called relief features. These being landforms have defined shape and heights above the sea level.
The cartographers use to show the relief features on the maps by employning certain methods which reflect their shape and heights in response to the physical appearance of the area.
The main methods employed for this purpose include the following:-
1. Contouring method.
The method involves the drawing of contours (isohypes) on the map face. Contour is an imaginary line drawn on the map face connecting all points of exactly equal height above the mean sea level. The first contour map was introduced in 1791.
Contours as used for relief representation on large scaled maps (topographical maps) reflect shape, size and height of landforms of areas represented.
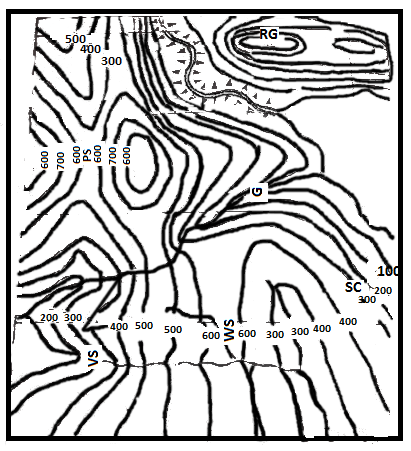
Properties of contours as used for relief representation.
(a) Contours on the maps are numbered either in Meter or feet. The numbers represent the attitude values of relief features in the region mapped.
There are two numbering the contours
• The contour numbers are written on the higher Side of the contour line.
• The contour numbers are placed in the contour lines
(b) Contours are drawn in a specific interval on the map.
(c)Contours of different elevations do not cross each Other.
(d)When Contours lie closely to one another indicate steep slope, and if observed to lie far apart indicate a gentle slope. Based to this, contours of different heights may join to form a single contour line where contours are not observed over wider part, implies the landscape is widely flat.
(e)Usually contour lines tend to join around where there is the presence of a rounded landform like; a hill, plateau, escarpment and others.
(f)Contours form V shape pointing up or down stream to indicate the presence of a river valley or spur respectively.
Merits of contours
• Contours are the most popular and widely used method for showing relief on topographical maps.
• Contours on a topographical map can be association with other methods of showing accurate heights of the relief features of an area represented. Provide the basis for hypsometric map construction.
• Contours on a topographical map can be associated with other methods of showing relief like; spot heights, trigonometrical point and benchmarks.
• Contours on a topographical map do not hide other details.
• Contours aid in making of some ground measurements from the topographical map.e.g/gradient determination
• Provide the basis for cross section drawing from the map. Setbacks of Contours
• Some times, contours fail to show certain highest heights due to the limitation of the vertical interval used. Such heights can be shown by means of spot or trigonometric point.
• Some of the landforms are not capable for being represented by means of contours e.g. coral reefs, levees and other of the same refletion .
• Contour are not suitable for showing relief on a small scaled map.
• It needs high skill to make interpretation on the relief features by reading the contours.
• It needs high skill to produce contours on map spot heights and form lines should be initially established ahead to contours.
• It becomes difficult to determine the exact altitudes of such parts which are not crossed by the contours.
The altitude of such parts given in estimation basis.
Setbacks of contours
Some times contours fail to show certain highest heights due to the limitation of the vertical interval used.such heights can be shown by means of sport height or trigonometric point.
2. Form lines
A surveyor has some times to draw contours by eyes by estimating where the contours would run between two sport heights or by sketching them in approximately (interpolating). The lines drawn in this way are called forms line. Hence forms lines are defined as the dotted and unnumbered lines drawn on the map face joining points of approximately the same heights.
Form lines are not always plotted at fixed interval and these provide the basis for establishment of contours or layer units on the map.
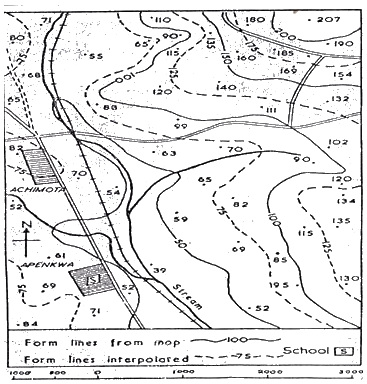
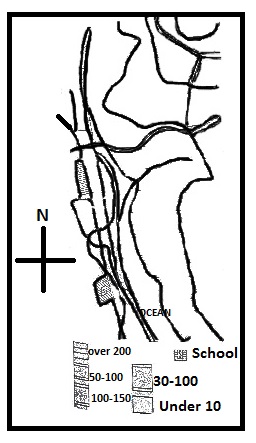
3. Layer tinting.
(Layer colouring)
It is one among the most useful methods for showing relief on maps. It is by indicating distinctive colours on the map face, to contrast zones (Bands) of altitudes. The method is mostly used for Relief representation on small scale maps (atlas maps).i.e. on maps that represent very wider parts of the earth’s surface.
A map that involves the system of colours to indicate relief is called hypsometric map. The method was firstly introduced in 1878.
Any layer –tinted map should carry a key to interpret the different colour for varied bands of altitude. The common colours used for this purpose include the following:-
- Blue; represents water body. Light blue means Shallow water and dark blue means deep
- Green, indicates low land of either coastal plain or river valley. Pure green colourrepresents much low land with altitude from 0-200m; while; light green represent lowland of high altitude from 200-500m).
- Yellow, indicates high land. Whitish yellow represents high lands of low altitude from 500-1000m); while pure yellow is for higher land with height from 1,000-2000m).
- Brown; indicates highest mountain or area with permanent ice.(2000-4000m).
- Red or pink, indicates very high elevation with height above 4000m

Merits of the layer tinting method.
- It makes a map look impressive and attractive to the users.
- It is useful method for showing relief on a small scale map.i.e on maps which represent wider areas.
- It is associated with the method of trigometric point. The trigonometric points provide specific exact highest altitude of particular part.
- They give quick information to map user so long the colours easily seen on the map.
Demerits of layer tinting method.
- It shows general altitude i.e. does not give the exact height of specific or particular point.
- It is more expensive to produce the layer colored map
- The method does not reflect the shape of relief features of an area on the map.
- Always colours carry certain people’s mind. It is therefore, someone may have wrong interpretation. e.g the presence of green colour on the map may makes some one to reflect the presence of thick ever green forest.
- If colours have already been used for layer tinting on the map ,can be used for other purposes on the same map.
- It is not a complete method by itself. It relies on the presence of contours or form lines to provide the basis for colouring.
4. Hachuring
The method involves the use of hachure.
Huchure is a series of small lines drawn on a map face showing the direction and steepness of slope. The lines are drawn to follow the slope of the ground or direction of the slope on which water would run. It is old method of showing relief on maps and it was devised by L.C Muller in 1788. It was later improved by Austrian topographer Johann George Lehman in 1799.
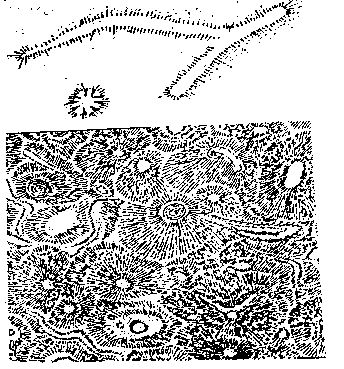
Merits of hachuring
- Hachure easily seen on the map and thus give quick information about the features represented.
- Provide pictorial view of the relief features on a map.i.e they can successively communicate quit specific shapes of terrain.
- Show clearly the direction of slopes on the map. i.e. They provide a general sense of steepness.
Demerits of hachuring.
- Hide other details seen on the map and thus give quick information about the features represented.
- Hachure on the map is non numeric.i.e.are not associated with height numbers of relief features represented. Thus, the map users are not in position to detect the relief heights by studying hachure.
- Greet skill is needed to produce hachure on a map.
- The hachure may not be maintained on constant scale.
- The method is dying out. It is not much used for relief representation on the modern constructed maps.
5. Hill shading.
It is a method of showing relief in which some parts of the map are shaded to indicate the presence of hill, as they would appear if a light were shining on them. Usually, the slopes which face light are shaded lightly while those facing away are in shadow.
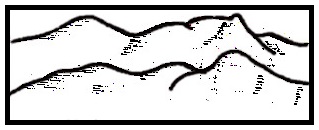
Merits of hill shading
- It gives pictorial view to the map user about the hills of an area shown on the map .it thus becomes easier to understand.
- Make a map looks impressive and attractive to the users
Demerits of Hill shading.
- Does not give heights of hill shown on the map.
- The shades indicated on the map might hide other details.
- It becomes difficult to determine the gradient of the hills represented so long, the hill shades not given with height numbers.
- May not easily maintain on constant scale of the map.
6. The use of physiographic diagrams.
The method involves the drawing of diagrams on a map face reflecting the physical slope of the relief features like hills and mountains as they have been observed in the area. This conventional representation of land forms on the map, gives an impression of viewing the landforms in three dimensions.
The physiographic diagrams are also known as pictorials.
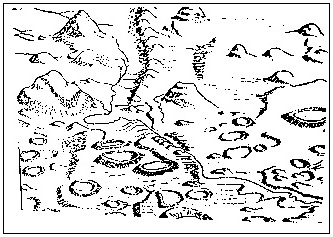
Merits of the physiographic diagrams
- The physiographic diagrams if appear on the map, become impressive and attractive to the map users.
- The diagrams provide more pictorial view of the relief features representated as they more reflect the shape of the land forms represented. It is thus, becomes so much easier to understand.
- They are easily seen on the map and thus easy to read and provide quick information to the map users.
Demerits of Physiographic diagram
- Hide other details.i.e may not make other details for the represented area to appear on the map.
- Physiographic diagrams are non numeric as do not provide the heights of landforms represented thus, they do not make the map users to understand the altitudes of the represented relief features.
- Only limited landforms can be shown. i.e. not all landforms can be shown by this particular method.
- Not good method for the accurate maps as the physiographic diagrams cannot be maintained on the constant scale of the map.
- The method is no longer used for relief representation on the modern constructed maps.
7. Trigonometric point.
It is a very small triangle conventional sign with a dot at its centre and value number beside to it. This is non imaginary method for relief representation on the map as trigonometric points established up on the presence of height ground station. (Trigonometric station) on the ground. It is thus, trigonometric point is indicated on the map provided the represented area has trigonometric station.
The number given with the trigonometric point represents the highest altitude of the land scape
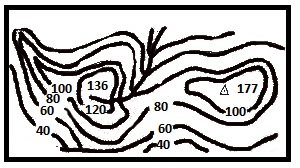
Merits of the trigonometric point.
- It is easy to indicate trigonometric point on the map by the cartographer
- It is non imaginary method for relief representation on the map.
- Enables the map users to recognize the highest relief height very easily.
- It shows the accurate relief height as it was measured more accurately in are above the sea level or from a recognized reference point of bench mark.
- Sometimes. it assists the contouring method in showing certain relief heights due to the limitation of the contours interval used.
Demerits of the trigonometric point.
- Not easily seen on the topographical map. It is as the topographical map shown the general geographical details of an area represented.
- Trigonometric point on a map does not give the shape of the relief feature represented.
- They are selective for showing only the highest heights of the relief features represented.
8. Spot height
It is a conventional dot (point) together with the height number on a map face. It serves imaginary method for showing relief heights as have been measured above the mean sea level. The number shows the height of a relief feature shown on the map
Merits of the Spot height.
- It is easy to indicate spot height on the map by the cartographer.
- Enables the map users to recognize the relief height very easily.
- It shows the accurate relief height as it was measured more accurately in the area above the sea level or from recognized reference point of a bench mark.
- Sometimes; it assists the contouring method in showing certain heights due to the limitation of the contours interval.
- It shows the heights of hill summits as well as points along the interested structures
Demerits of spot height.
- Not easily seen on the topographical map. It is so as the topographical map shows the general geographical details of an area represented.
- Spot height on a map does not give the shape of the relief feature represented.
- It is imaginary method for showing relief on a map.
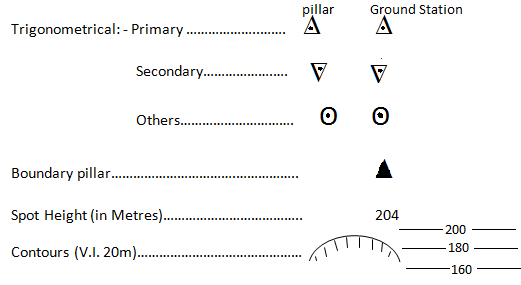
9. Bench mark
It is a surveyor mark unit indicated on a wall, pillar, or building used as reference point in measuring altitudes.
Or
a point of reference used by a surveyor in measuring altitudes.
Bench marks indicated on maps following the presence of such marks in the are mapped.
Bench marks on maps appear by the conventional letter of BM together with height numbers measured on the ground.
Categories of Bench marks.
Bench marks indicated on the map and up on the landscape represented are extremely varied. Some have been established to provide permanent reference in measuring altitudes, while others provide short terms reference to measure altitudes by doing surveying. With respect to this, bench marks are categorized into two and include the following:-
Temporary bench mark
These established so closely to the site of surveyor to have continuous reference in surveying process. They use to appear by conventional letters of TBM. However; these on topographical maps do not commonly appear.
Ordinance bench marks.
These are the fixed bench marks indicated on the map with reflection to the actual area represented. They provide permanent reference in measuring altitudes of other interested point or areas.
Merits of the bench mark.
It is easy to indicate it on the map by the cartographer.
It is non imaginary method for relief representation on the map.
It shows the accurate relief height as it was measured more accurate on the landscape above the sea level.
Demerits of the bench mark.
Not easily seen on the topographical map. It is as the topographical map shows the general geographical details of an area represented.
Bench mark on a map does not give the shape of the relief feature represented.
Asses yourself!
Are you able to describe the different methods of showing relief on maps?
Do you understand the application of the different methods as used for relief representation?
Are able to narrate the merits and demerits of the methods as used to show relief on the map?
EXERCISE
Q. (i) why contours are considered to be the most useful ways of showing relief? (NETA 2007).
(ii) Explain the demerits of using hartures to represent relief on the map (NECTA – 2007).
Q. Outline and describe the different methods employed by the map maker to show the exact height of relief features on the map (NECTA 1997).
Q. (i) Describe the methods used to portray the relief features on the map.
(ii) Which other methods may have been used to depict the relief features on the map? (NECTA 2003, The map extract of Songea sheet 299/1).
Q. Describe any two demerits of hill shading as a method of representing relief on the map. (NECTA 2002).
CARTOGRAPHIC SYMBOL AND SIGN
Topographical maps are drawn for geographical studies do not show the natural and artificial features as they appear in real life on the earth’s surface. Some of the selected conventional signs and symbols used to serve this purpose, and these are collectively referred to cartographic symbols and signs.
Hence the cartographic symbols and signs are defined as the conventional signs and symbols inserted on a face of a topographical map representing the natural and artificial features of an area mapped.
They act as language of map to provide geographical details of areas represented.
The cartographic symbols and signs are used to represent the natural and cultural features on the topographical maps, should have the following qualities.
• Should be correctly and clearly shown on the map.
• They should be easy to read.
• Easy to understand and interpret
Note.
Symbols are those used in maps which look like the natural and artificial features represented, while the signs are those which do not look like the natural and artificial features represented.
CLASSIFICATION OF THE CARTOGRAPHIC SYMBOLS AND SIGNS
Cartographic symbols and signs are extremely varied and thus, classified into different types. They are classified according to their form of appearance on the map, and nature of data shown on the map.
According to the form of appearance, cartographic symbols and signs classified into the following types:-
Point cartographic sign:-
These are the cartographic signs in form of dots inserted on the map face. They are employed to show positional data on the mp. i.e. show a specific point on the map and up on the earth’s surface there a certain object or place occurs.
Line cartographic symbols:-
These are the conventional symbols, which take linear distinctive form of appearance on the map. They are employed to represent the elongated objects on the map with reflection to an area represented. Examples of the elongated objects represented by the line cartographic symbols are of; power transmission lines, roads, railway and administrative boundaries.
Areal cartographic sign:-
It is the conventional representation established on the map by which a continuous distinctive shade or tone employed to show a feature that covers wider part. Such features include; swaps, plantation, lakes and others.
Pictorial (descriptive) cartographic symbols:-
The conventional symbols given on the map to portray the shape of the features represented. e.g. the symbols for church, mosque, bridge and others of the same reflection.
Geometric cartographic signs:-
The conventional signs in form of geometric figures of like square, triangle, circle and other e.g. the trigonometrically point.
Letter or number cartographic signs:-
The conventional representing on a map in which one or more letter or numbers given. E.g. such for school, ch-for church, pwd – for public work department and others.
According to the nature of the features represented, cartographic symbols categorized as follow:-
Relief cartographic symbols:-
These are the symbols inserted on the map, representing the relief of an area. They include; contours, hachure, spot heights, trigonometric point and others.
(b) Transportation cartographic symbols:-
The conventional signs representing transportation systems of areas represented of like; roads, railways, air fields etc.
(c) Vegetation cerographical symbols:-
The symbols for natural and planted vegetation.
(d) Settlements cartographic symbols:-
The symbols, which represent both rural and urban settlements of an area on the map. They include round black dots for rural settlements and black rectangle blocks for urban settlements.
(e) Water bodies (hydrograph) cartographic symbols.
These given on the map to make representation of the water body systems.
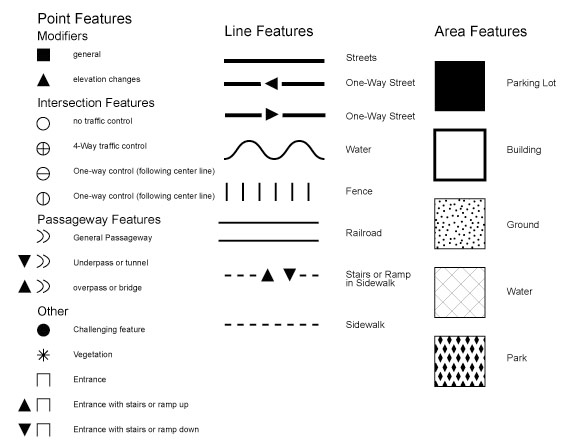
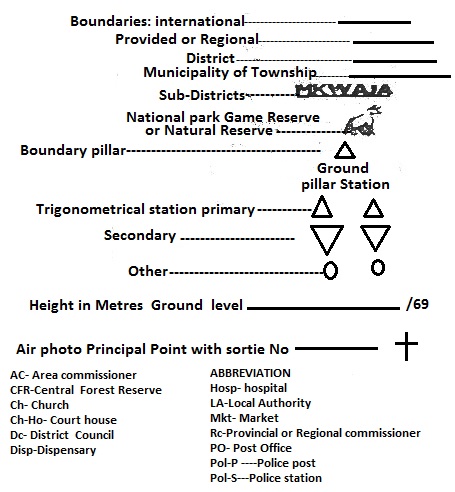
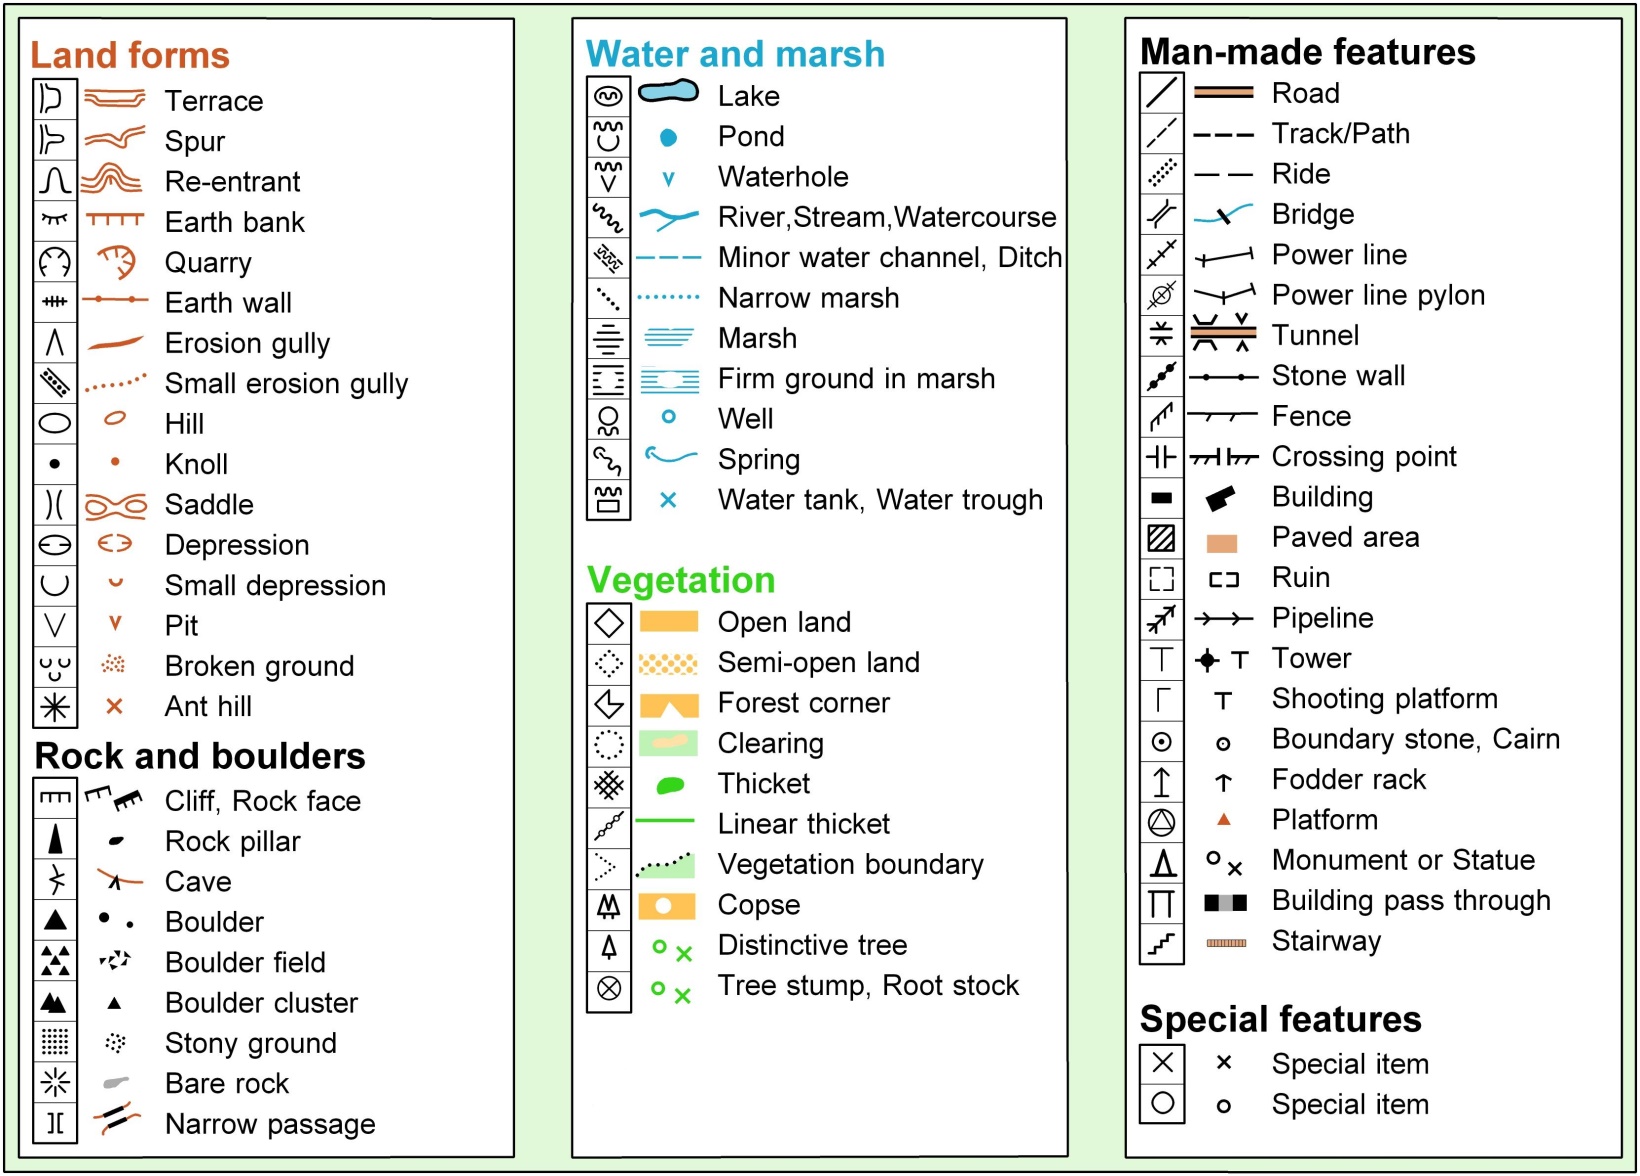
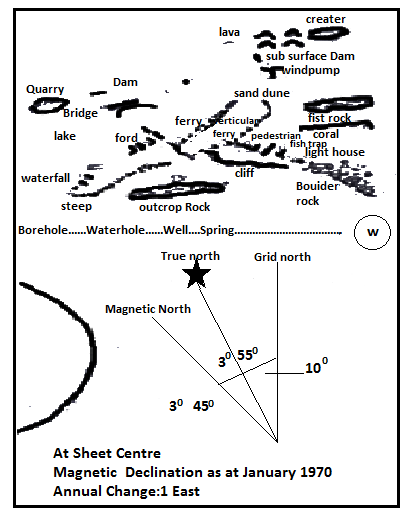
Asses yourself!
Are you able to define cartographic symbols and signs?
Do you understand the main qualities of cartographic symbols and sign?
Are you able to describe the different types of cartographic symbols and signs according to different elements of variation?
CROSS SECTION, INTERVISIBILITY, HORIZONTAL EQUIVALENT AND GRADIENT.
CROSS SECTION
Cross section is a transect diagram or topographical profile of an area drawn on a paper with details taken from the topographical map to show the structural appearance of the landscape in between of the two points. It is alternatively known as relief section or topographical profile.
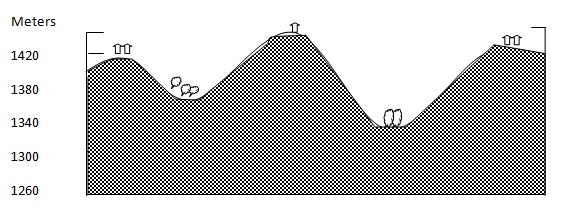
Cross section is of two types and include; the simple (sketch) and annotated cross sections.
Simple-cross section is the one not drawn to scale and is made to show the general appearance of the landscape between the given points in terms of relief.
Simple cross section is drawn after estimation of the general rise and fall of the landscape. The estimation is done after the study of the contours on the given map. Beside to this,
altitudes along the vertical lines not given.
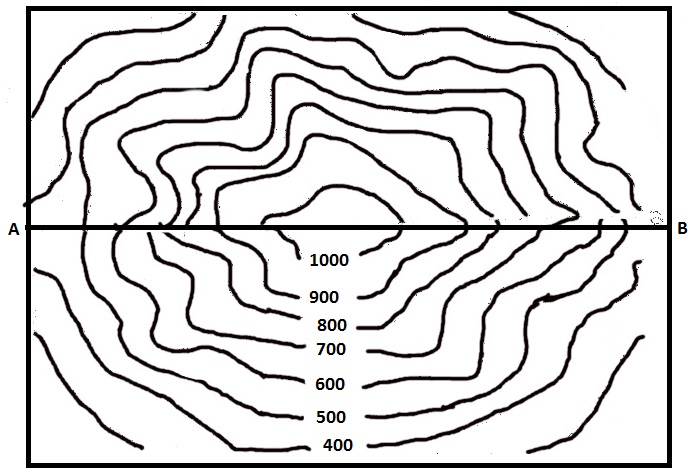
(i) An area to be sketched.
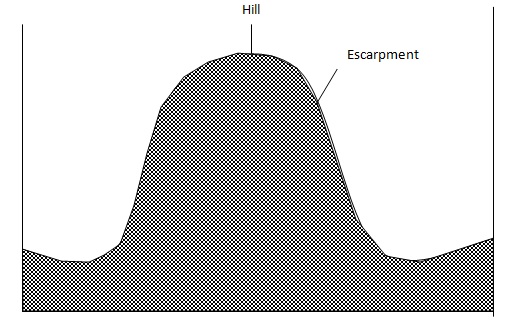
(ii) Simple cross section from A – B
The annotated cross section is the one drawn to scale and in which the position of important places and features indicated more accurately. It is also known as accurate cross
section.
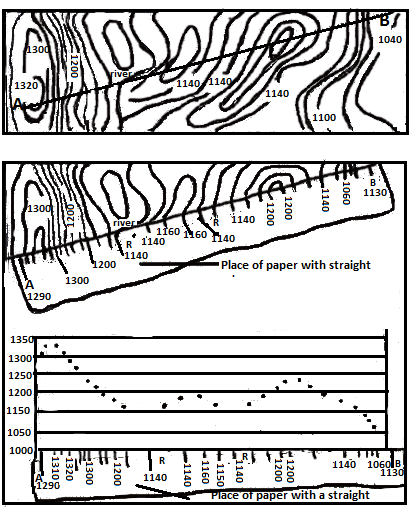
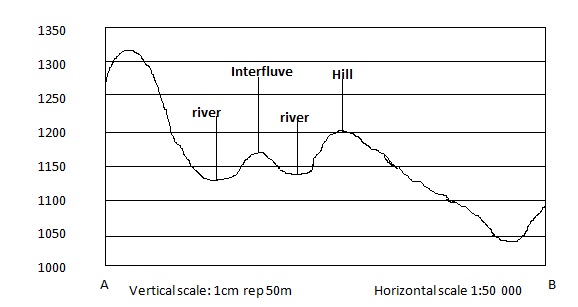
The significance of a cross section.
Provides a clear pictorial view on the structural appearance of area in between the two places. With respect to this, a person may easily determine types of slope in the area and the appearance of the area whether undulating or un undulating.
It is useful for indivisibility determination between two points in the area. This is made possible as a cross section shows physical appearance of an cross section shows physical appearance of area and if clearly observed, the judgment of indivisibility becomes easier.
It shows clearly the altitudes of the different parts of the landscape in between of the two points in the area.
Cross section aid in making of gradient determination of the sloped landscape by relating the VI to HE.
CONSTRUCTION OF THE CROSS SECTION
The construction of cross section should fundamentally follow the following significant steps.
1. Identify and mark the two end points to be sketched on the topographical map. The points can be identified by taking into consideration of the grid references or place names given.
e.g. A and B.
2. 2. Draw the straight line with the use of a ruler on the map to join the two identified points.
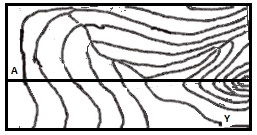
3. 3. Take a piece of paper with a straight edge, or fold it to get straight edge and place along the drawn straight line on the map. The piece of paper has to be slightly longer than the length of
the line joining the two end points.
On the piece of paper mark the following important details.
The two end points, which have been identified on the map.
Where every contour line cuts the line.
The contour heights.
The important landscape feature of both, natural and cultural features.
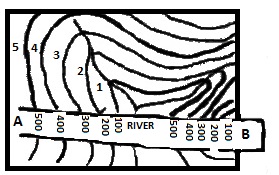
4. Find the appropriate vertical and horizontal scales. The vertical scale is determined as follows:-

According to the traverse on given contoured map:

Thus; VS, 1cm represents 100m.
Vertical scale shows the relationship of height between the cross section and the actual landscape represented.
Note.
The graph space for the vertical distance of cross section lies up on a decision. Graph space should conditionally produce the vertical scale that can not results into vertical exaggeration that appears more than 10 or less than 5 as related to horizontal scale.
The horizontal scale remains to be the same to that used on the map. This provides the relationship of horizontal distance to actual ground represented.
5. 5. Construct the framework for drawing the cross section. The framework should have both vertical and horizontal line distances. The horizontal line distance is determined by the length from one point to another on the map. The measurement of the vertical line has to correspond to the decided graph space.
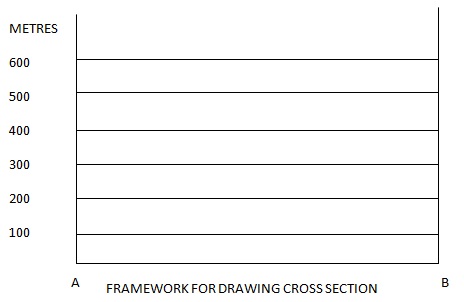
6.Take the piece of paper which has been marked with the map details for cross section, and place along the horizontal line distance of the framework. Relate the height numbers to those allocated along the vertical line distance.
7. 7. Connect the plotted points with pencil using the free hand to develop the structural appearance of the landscape.
8. 8. Finish the cross section by including the following:-
Heading; To show what the cross section is for about.
Natural and cultural features; These if clearly indicated show the clear outlay of what is represented by the cross section.
Vertical scale; This shows the relationship of altitudes between the cross section and actual ground represented.
Horizontal scale; This shows the relationship of horizontal distance between the cross section and landscape represented.
Vertical exaggeration; It shows the relationship between vertical and horizontal scale of the cross section.
Key, if necessary.
North direction.
The source.
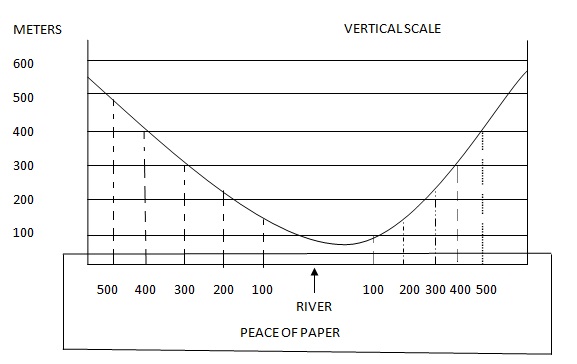
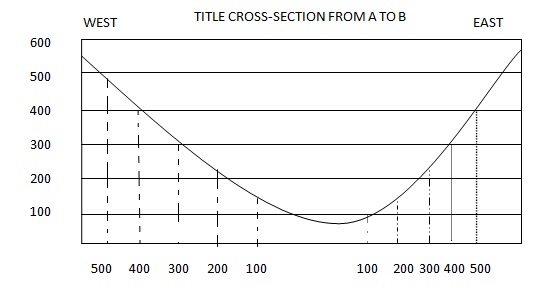
Horizontal scale ; 1:50,000
Vertical scale; 1:10,000
VE = 5
VERTICAL EXAGGERATION
A cross section by its nature has both, vertical and horizontal scales. The vertical scale is nearly always subjective, while the horizontal scale is steadily constant. The vertical scale by being subjective, it can be magnified. The amount of magnification of the vertical scale over horizontal scale is known as vertical exaggeration. Vertical exaggeration is thus, defined as the amount of times by which the vertical scale is larger over horizontal scale.
Or
The relationship between the vertical scale to horizontal scale of cross section.
Vertical exaggeration is very important in cross section drawing as it determines the shape of the features represented on the cross section.
The standard vertical exaggeration of the cross section drawn from most of the topographical maps with scale of 1:50,000, is that which does not exceed 10 units and not less than 5 units.
Vertical exaggeration is principally determined by applying either one of the following two principle formula:-
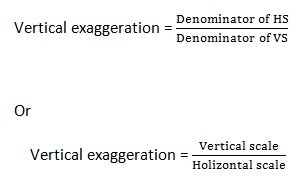
Example:-
If a cross section has the horizontal scale of 1:50,000 and vertical scale of 1:10,000, whose vertical exaggeration is determined as follows:-
![]()
According to the cross section:-
Horizontal scale = 1:50,000
Vertical scale = 1:10,000
Then; 50,000
10,000
Thus, the VE = 5. This implies the vertical scale is larger for 5 times to Horizontal scale.
INTERVISIBILITY
Indivisibility is the act of establishing whether the two positions in the area as observed on the map visible to one another or not.
A good way of realizing the indivisibility of two points on the map is by drawing a cross section from one point to another to view the structural appearance of landscape. On the cross section, draw a straight line called sight line to connect the two end points.
- If the straight line passes clearly between the two points, it implies the sighting from one point to another is not obstructed and hence, the two positions are intervisibility.
- If the land rises high above the sight line, implies that, the sighting from one point to another is obstructed thus, the two positions are not intervisibility.
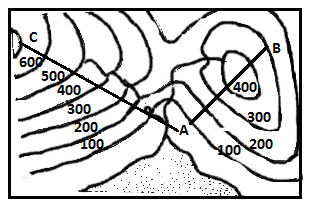
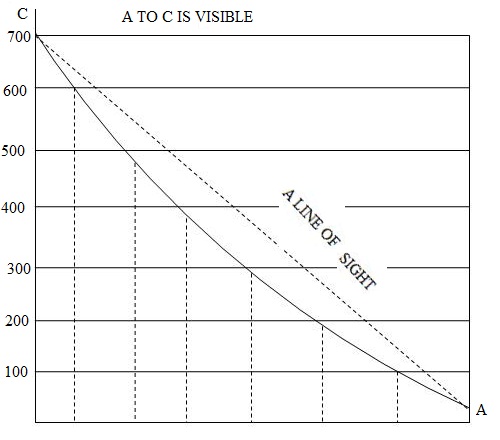
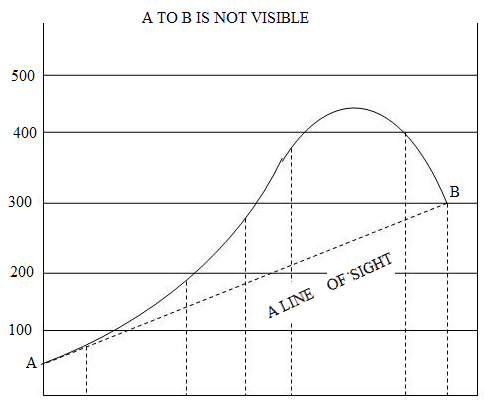
Factors affecting indivisibility.
Interivisibility between points on the map and up on areas on the earth’s surface effected by the following factors.
- Relief; Natural features like mountain, hill and others in between of positions, affect intervisibility.
- Vegetation; presence of thick forest in between of positions also affects intervisibility.
- Buildings; the presence of tall buildings in between two positions also hinder intervisibility.
HORIZONTAL EQUIVALENT (HE).
Horizontal equivalent refers to a horizontal distance of the sloped landscape in relation to its vertical height.
Horizontal equivalent can be high, low or nil depending on the degree of a slope steepness.
Gentle slope; gives higher horizontal equivalent.
Steep slope; gives low horizontal equivalent.
Vertical slope; gives low horizontal equivalent
Horizontal equivalent is worked by converting the CD into AD with respect to map scale.
Example:-
Scale is 1cm=½km
CD = 10 cm
10 x½km =5 km Or 5000m.
Thus; the horizontal equivalent is 5,000m or 5km.
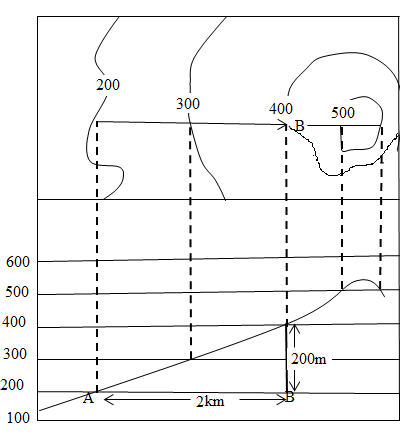
GRADIENT
Gradient is a degree of slope steepness; or the ratio between the vertical interval (increase) to horizontal equivalent; or the amount of rise or fall in meter or feet of the land in relation to horizontal distance.
Gradient is determined by the following principle formula:-
![]()
Where by:
VI=vertical interval; It is the difference in height meter or feet between the highest and lowest altitudes of the two recommended points.
HE = Horizontal equivalent; It is the distance between the two given points as measured from the map.
Procedure for gradient determination.
Identify the two points and name them like A and B.
Join the points using a straight line to form line AB.
Measure the ground distance between the two points.
Calculate the actual distance using map scale given to get the horizontal equivalent (HE).
Calculate the difference in height between the two points using the contours.
Using the formula to have the gradient.
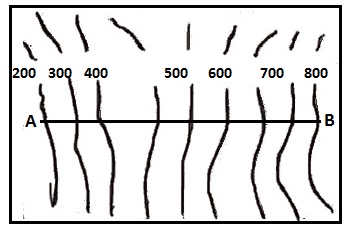
(a) Gradient of a slope from point A to B
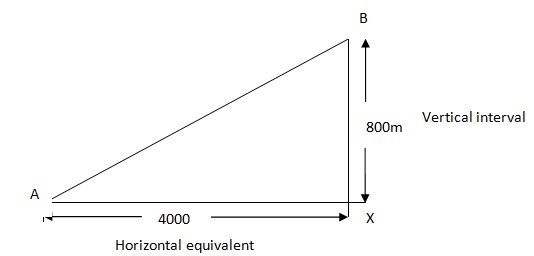
![]()
According to the given case on the map;
Highest altitude = 1,000 m
Lowest altitude = 200 m
CD = 8 cm
Scale; I cm represents 0.5km.
Then;
1,000m – 200m
(8 x 0.5km) x 1,000m
800 = 1
4,000 5
Thus; the gradient is 1 in 5. This implies there is a rise of 1 m high in every horizontal distance of 5m from A to B Or there is a fall of 1 m low in every horizontal distance of 5 m from B to A.
Average Gradient.
Average gradient is a degree of slope steepness for the elongated feature.The elongated feature can be of like a road, river, railway and others of the same nature.
Procedure for average gradient determination.
Identify the two points of the elongated feature.
Measure the length of the elongated feature on the map to get the CD.
Convert the CD into AD b using map scale to get HE.
Calculate the difference in height of the feature using the contours.
Using the formula to have the gradient.
Example:-
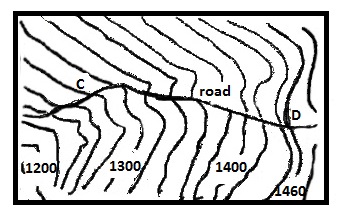
The average gradient for the road is determined as follow:-
![]()
According to the given case on the map;
Highest altitude = 1,460m
Lowest altitude = 1280m
CD =12cm
Scale; 1cm represents 0.5km.
Then;
1,460m – 1280m
(12 x 0.5km) x 1,000m
1180 = 1
6,000 5
Thus; the average gradient of the road is 1 in 5. This implies; the road experiences a fall or rise of I m low and high respectively in every horizontal distance of 5m in between of points C and D.
Asses your self!
Are you able to define a cross section?
Are you able to describe the kinds of cross section?
Are you able to narrate the significance of drawing a cross section?
Are you able to draw a cross section?
Are able to narrate the factors affecting intervisibility?
Are your able to suggest intervisibility by considering cross section and affecting factors?
Are you to define horizontal equivalent and gradient?
Are you able to calculate gradient and horizontal equivalent.
EXERCISE
Qn. Calculate the gradient between Fotobiro hill and the point at grid reference
040640 (necta 2002 – Extract map of Nyakwere).
Qn. On the map drawn on scale of 2cms to 16 kms, there are two towns, A (altitude 800 meters and B altitude 1200 meters).
(i) calculate the gradient of the slope if the distance between the towns measures 4.2 cm the map.
(ii) Find the vertical exaggeration of the cross section if the vertical scale is 1:80,000. (NECTA 1997).
Qn. Draw a cross section from Mahenge peak and the western peak of Wibete
hill. (NECTA 1993; Extract map of Dodoma West sheet 162 /1).
Qn. The airfield and the top of the hill at Ilboru are 6.6kms apart. Calculate the
gradient between them (NECTA 1992; map extract part of TANZANIA – ARUSHA sheet 55/3).
Qn. Construct a neat annotated cross section from grid reference 630770 to 740770 (NECTA 1980 – the map extract part of TANZANIA – MONGOYO (Series Y742 sheet 295/1 Edition 1 TSD).
Qn. How would you determine the following on a topographical map?
Stream gradient.
Vertical exaggeration.
Horizontal equivalent (NECTA – 1983).
Qn. (i) Draw a cross section from Grid 360280 to 460330 and show area with plantation agriculture and the three major rivers.
(ii) calculate the vertical exaggeration.
(NECTA 1992 map extract part of TANZANIA – ARUSHA sheet 55/3).
Qn. Draw a cross section from point A to B , and calculate the vertical
exaggeration (NECTA 1989).
Qn. Determine the average gradient of river Kwamu kwme from grid 234626 to grid 196596. (NECTA – 2001, the map extract of KONDOa (sheet 104/4).
Qn. Calculate the gradient from Gr 000315 to Gr 020320. (NECTA – 1999, the map extract of BABATI (Y.742).
Qn. Calculate the vertical exaggeration for a topographical section across a map whose horizontal scale is one to one km and the subdivision of the vertical scale being one cm representing 50 m. (NECTA 1988).
RELIEF FEATURES IDENTIFICATION ON TOPOGRAPHICAL MAPS
Topographical maps show numerous relief features of areas represented. The relief features are widely shown by means of contours. Usually contours on maps occupy patterns with respect to the shape of the landforms (relief features). The identification of landforms on the topographical map is by looking the patterns of the contours as well as their numbers. This can be aided by drawing a cross section.
Identification of the varied landforms on the topographical maps with respect to their shape is as follows
1.Hill.
Hill is a rounded up land not as high as mountain.
Or
As small rounded upland of low height above the surrounding area.
On the topographical map, hill is recognized by the presence of roughly circular contours close together and the last highest contour round small space on the map.
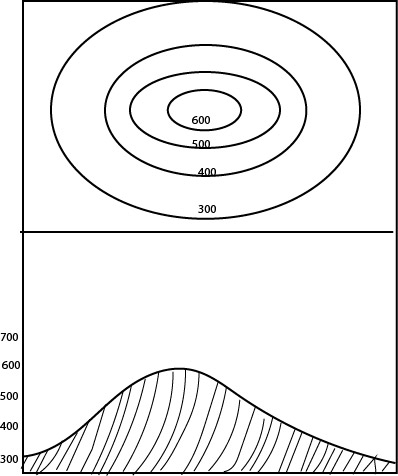
2. Plateau.
A plateau is an extensive upland with steep slopes and fairly gentle slope or flat on the top surface.
On the topographical map, plateau owning to its nature is recognized up on the presence of roughly circular contours close to one another but, the last highest contour rounds a large space on the map
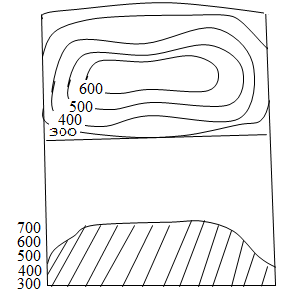
3. Ridge.
Ridge is a big, narrow and long with steep slopes. It is recognized if there is the presence circular elongated contours close to one another.
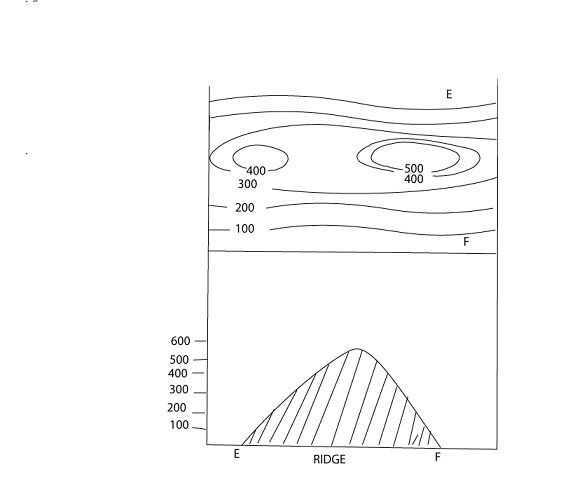
4. An escarpment.
It is an upland that has gentle slope on one side and steep slope on the other side. On the topographical map, escarpment is recognized if there is the presence of roughly circular contours observed be very close to one another at one part and far part at the other side.
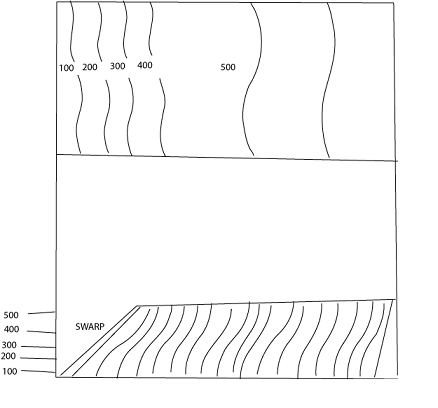
5. Slope.
Slope is a slanting piece of landscape. Or the ground that progressively falls or rises from one area to another.
There are five types of slopes and include:-
Steep slope.
Gentle slope.
Concave slope.
Convex slope.
Vertical slope.
(a) Steep slope.
Steep slope is the one that has high degree of steepness evenly from the top to the bottom. Steep slope is recognized if on a topographical map, contours lie evenly spaced much close to one another from the top to the bottom.
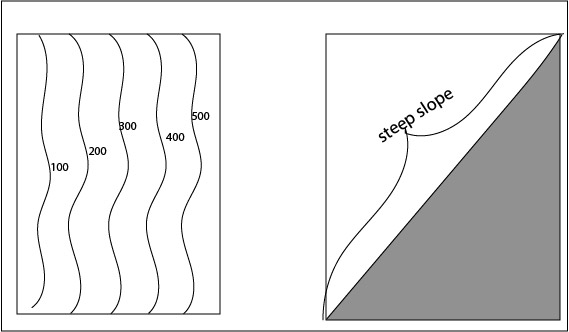
(b) Gentle slope / regular slope
Gentle slope refers to a kind of slope that has low degree of steepness more evenly from the top to the bottom.
On the topographical map, gentle slope is recognized if contours indicating the presence of slating land, observed to lie far apart evenly spaced from the top to the bottom.
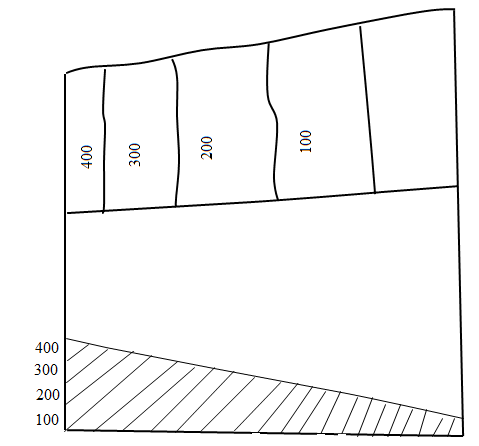
(c) Concave slope.
It is a slanting land, which is steep at the top and gentle at bottom. Or a slope that appears to have high degree of steepness at the top and low degree of steep at bottom. Concave slope is recognized if the contours indicating slanting land, observed to be closely spaced at the top part and wider apart at the bottom.
(d) Convex slope.
It is the slanting land which has low degree of steepness at the top and high degree of steepness at the bottom. The contours of convex slope are close to one another at the bottom and wider apart at the top.
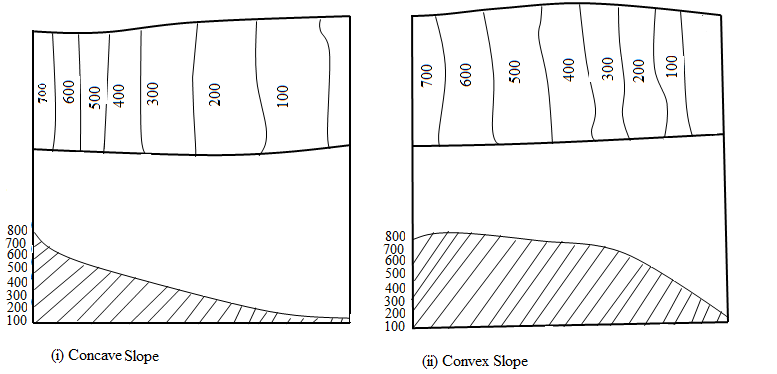
(e) Vertical slope.
It is the slope that has right angle steepness of about 90°. It is recognized if contours of different elevation join and form a single contour line.
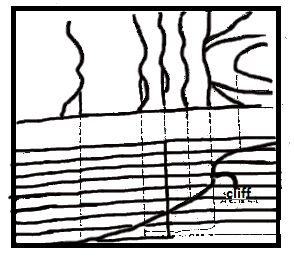
6. Saddle or Col.
A saddle or col is a low lying land in mountain range, which connects two mountain peaks or hill. The contours of a saddle or col that enclose two mountain peaks or hills, run roughly parallel and are far apart at the low lying land.
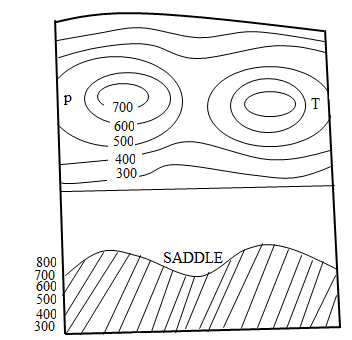
7. Pass.
Pass is a gap through a mountain allowing a through passage to different directions. Pass on the map is recognized, if contours of mountain peaks roughly converge towards a low-lying area.

8. Watershed.
Watershed is a line dividing the headwaters of two or more streams flowing to different directions. On the contoured map, watershed is recognized provided the highest contours run parallel to each other and streams of water appear to diverge to different directions.
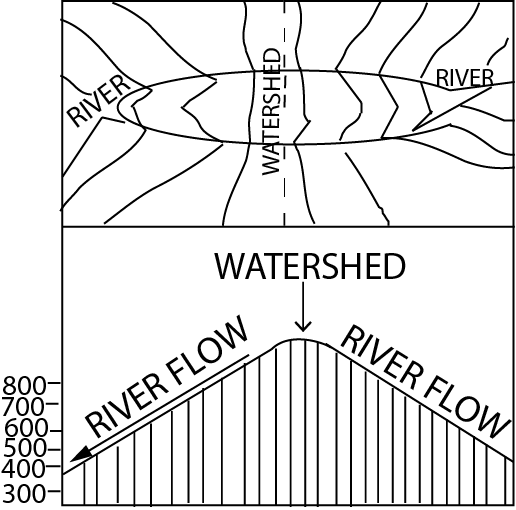
9.rRr River valley:-
River valley is a long narrow and deep depression through which a river
flow. On the topographical map river valley, is recognized if the contours form V shape and the river crosses each contour.
figure here
10. Spur:-
Spur is a projection of land or broad tongue of land from the side of a hill or mountain towards the valley. Spur is recognized if the contours form a V shape pointing down low lying area.
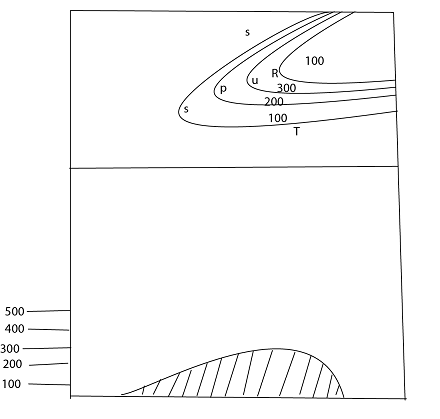
11. Gorge.
Gorge is a deep, narrow, steeply sided river valley. The contours of a gorge are close together forming a narrow V shape pointing sharply up-stream and the river crosses each contour.

12. Flood plain
A flood plain is a flat low lying area lies immediately after river channel built up by deposition of alluvium. Flood plain on the map is recognized if the contours run roughly parallel to the main river and the lowest contours are spaced enough in a way that, it marks a general width of the flood plain.
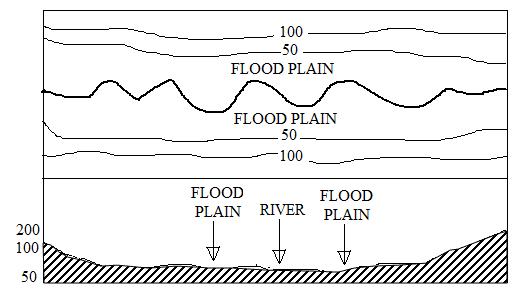
13. Delta:-
A delta is a flat low lying area of alluvial deposits at the mouth of the river crossed by many distributaries. On the topographical map, delta is recognized if the lowest contours follow roughly the area with tributaries.
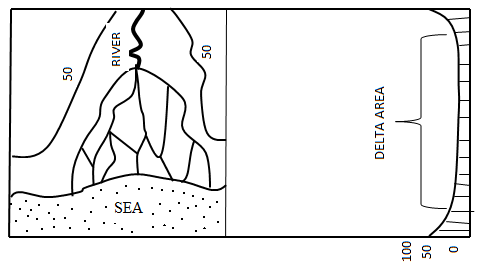
14. Estuaries:-
An estuary is a single broad river mount where a river enters a lake or sea. The contours of an estuary are widely spaced forming the wide V shape that point up stream.
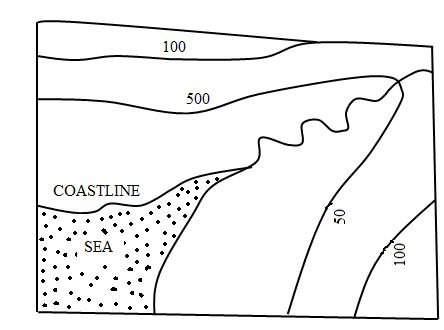
15. Cliffs.
A cliff is a high rock face along a coast, river or lake. On the topographical map, cliff may be indicated in two ways.
(a) A cliff may be shaded by short lines drawn at right angles to the coast, river or lake to indicate the steepness of it.
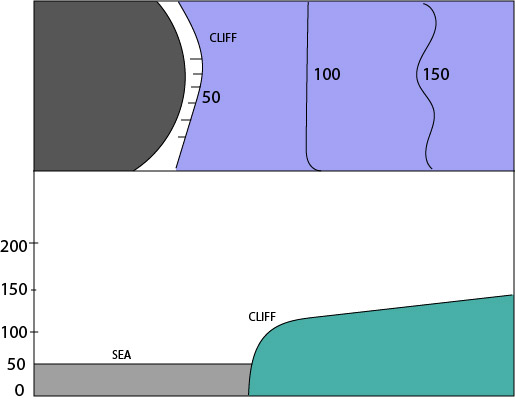
(b) Cliff on the topographical map may also be observed by the presence of contours of different elevations, join and form a single contour line parallel to the sea, lake or river.
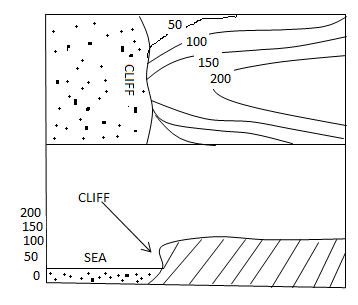
16. Levees:-
Levees are the natural embankments built up by a stream along the edges of its channel. On a topographical map, the embankments are shown by pecked lines at right angle to the course of the river.
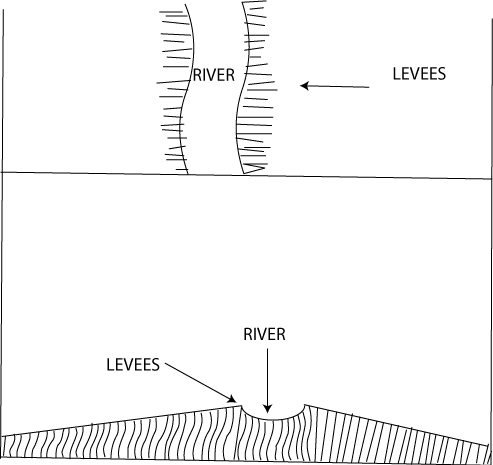
17. Coral fringed coastline.
Coral fringed coastline is formed by a coral platform which lies close to the shore. On a topographical map, the coral fringed coastline is marked clearly by shading or by using symbols to show the area with coral fringing reef in the sea.
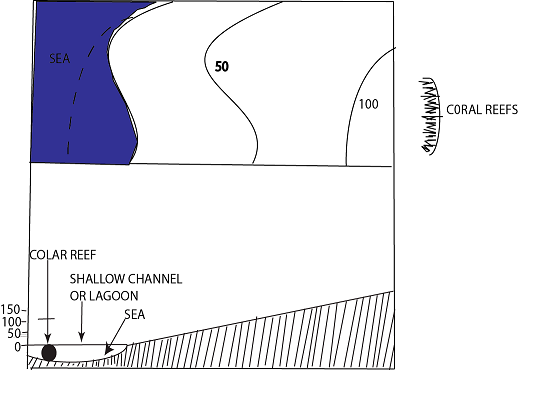
Asses your self!
Do you understand the nature of landforms commonly shown on topographical maps?
Are you able to identify different landforms the topographical map by considering the pattern of contours.
EXERCISE:-
Qn. (i) Describe the land forms shown on the map.
(ii) Mention two factors which have influenced the direction of tributary into tributary R
(iii) Identify the feature at Y. (NECTA – 1988).
Qn. Describe the major landforms depicted on the map. Use the specific examples from the area (NECTA 204, the map extract of Mwanza sheet 33/2).
Qn. What type of landforms are depicted on the map? (NECTA 2008).
Qn. What features are found at grid reference,
(i) 960200? (ii)01139?
(NECTA -1993, map extract part of Tanzania-Dodoma west Sheet 162/1).
Qn. Identify the features found in the following grid readings
(I) 690110 (ii) 579145 (iii) 674063 (iv) 553123
(NECTA 2012-Uyole extract map sheet 245/3).
MAP INTERPRETATION
Map interpretation is the art of examining the given topographical map to realize the reliable geographical details of an area represented. Geographical details may include; climate, economic activities, relief, mode of transport etc.
Map interpretation is done by looking the conventional symbols and signs on the map and realize what they stand for. Map interpretation has to entails two basic processes of map reading and map analysis.
Map reading; It is an art of examining the given topographical map to recognize the features that directed on the map.
Map analysis; It is the art of relating the features that appear on the map to other geographical facts which are required to be described, explained or suggested.
In the process of map reading; carefully read and note; the map conventional signs and symbols, key the date of compilation, title, north direction, latitude and longitudes, and other important marginal details. However the perfect skill for interpretation of the topographical maps requires constant practices and wider geographical knowledge.
With map interpretation; some one is able to describe and explain the following geographical details:-
- Climate.
- Human activities.
- Vegetation.
- Drainage.
- Geological nature.
- Relief.
- Geomorphologic processes.
- Communication.
- Population distribution and settlements.
1. CLIMATE
Climate is the average (overall) weather conditions experienced in an area especially large area for a long period of time or through out. It is thus; realization and description of climate of an area from the topographic maps is by taking into consideration of the facts much related to climate which commonly shown on the map. They considerably include the following:-
(i) Latitude:-
Climate conditions vary considerably from one latitude region to another. It is thus; if the latitude region in which the mapped area is found observed, map user may realize the more likely climatic conditions of the area with regards to the wider geographical knowledge the person has.
The latitude region is recognized by taking into consideration of the degree numbers indicated along the map edge from bottom to the top or from south to north. Such degree numbers are of latitude values. Therefore; once you are given a topographical map to establish the climate of the respective area, try to observe the latitudes of the mapped are to understand in which geographical position over earth’s surface the mapped area represented is located.
For instance:-
If the mapped area understudy is located from or in between 0° – 5° north and south of the equator, it implies that, the area is located in the equatorial belt.If other considerations remain constant, the area is suggested to experience equatorial climatic pattern with the following conditions:-
High rainfall through out the year with two maxima peaks i.e. there is no prolonged dry season.
High temperature throughout the year with small annual range.
If the map along its edge shows any latitudes in between of 6° – 20° North and south of the equator. It implies the area represented on the map located in tropical region. If other considerations remain constant, the area is judged to experience tropical climatic type with conditions of:
-Moderately high rainfall which varies annually i.e. there is the presence of both wet and dry seasons in a year.
-Temperature is high with great annual range.
However; if the altitude is below 500m; the area can be suggested to
have coastal tropical climate with long rain season; but if altitude is above 500m, the area can be established to have continental (interior) tropical climate.
Note.
It is important for the map users to be aware with the climatic conditions experienced in varied natural regions.
(ii). Altitude.
Altitude means the height of an area from the mean sea level. Altitude has a considerable impact on climate as temperature and rainfall regime is influenced by altitudes. It is therefore, the consideration of altitude of an area from the map, may help to suggest the likely climatic conditions. With respect to this, once you are given a topographical map to suggest climate, consider the altitude of the area by reading the number of contours, spot height, bench mark and trigonometric points to realize whether the area represented on the map is of lowland or high land.
If the altitude is higher mostly above 2000m implies the area represented is of much highland and likely to experience highland climatic pattern featured by high rains of orographical type which may vary with aspect and low annual temperature as greatly lowered by higher altitude.
If the contours and other means show low height numbers, give an impression that, the area is of lowland and likely to experience high temperature.
(iii) Water bodies (drainage).
Drainages are very good guides to climate particularly on the relative amount of rainfall. It is so as the sources of water bodies in any are on the earth’s surface is mostly by the amount of rain fall received.
Presence of the salt lakes, seasonal streams, boreholes, seasonal swamps and widely spaced streams suggest that, the rains in the area are seasonal with long period of dry conditions.
Presence of abundant permanent streams and permanent swamps, suggests heavy rainfall received in the area.
Presence of the sea, suggests maritime (coastal) climate.
Presence of lake particularly that of Victoria reflects lake equatorial type of climate.
(iv) Natural vegetation and crops
Natural vegetation and crops shown on the map have reflection to certain climatic conditions and thus; are also good guide to climate.
Natural vegetation
Presence of thick forests on a map and up on the respective area indicates high annual rains.
Woodland vegetation reflects moderate high annual rains.
Scrubs, scattered trees and thickets vegetation reflect seasonal rains.
Crops.
Crops are raised depending on the climatic conditions that favour their growth. Hence; the consideration of crops cultivated, helps to deduce temperature and rainfall conditions of an area observed on the map.
Presence of coffee and tea on the map and up on the area represented, suggests cool wet climate.
Presence of cotton, sisal and cashew nuts suggests moderately high seasonal rainfall and high temperature.
NOTE.
Always the suggestion of climate of an area from the topographical map, students should not rely on a single guiding fact. Consideration should be centered on more than one guiding facts. It is so in a basis that, climate is influenced by a number of varied factors. It is thus; one considered factor, may not give the absolute reality about the climate of an area.
In East Africa from which most of the topographical maps for examination purpose extracted, the following types of climate experienced.
Tropical climate.
This is experienced over most of Tanzania exception in dry region of the central Tanzania. The climate is characterized as follows.
High temperature with great annual range and in high plateau temperatures bit lower as result of high altitude.
The amount of rainfall is moderately high and occurs in one season.
Sub tropical climate:-
It is the type of climate experienced in high land areas with in the equatorial belt. It is very common in Kilimanjaro, Kenya highlands, Kigezi, Ngara and Karagwe. The sub tropical climate is characterized as follows:-
Desert and semi desert climates:-
This type of climate is experienced in areas of central Tanzania, Northern Kenya and North eastern Kenya; and north eastern Uganda. Desert and semi desert climate is characterized as follow;-
Temperatures are high around 27°C with very high annual range.
Annual rainfall is generally low with long dry season.
Coastal Tropical climate.
This type of climate experienced along the coast of East Africa and its islands. The climate is very common in Dar es Salaam, Mombasa, Tanga and others coastal areas.
The costal tropical climate is characterized as follows:-
Long heavy rain season.
Temperature is high with great annual range.
Lake equatorial climate.
This is experienced around lake Victoria, in Tanzania, Kenya and Uganda. The climate is characterized by the following conditions:-
Moderately high temperatures.
Moderately high rain rainfall.
Important climate description hints.
Produce a statement in connection to what is to be described about climate.
Give the type of climate and its conditions.
Establish the evidences to reinforce your description (suggestion).
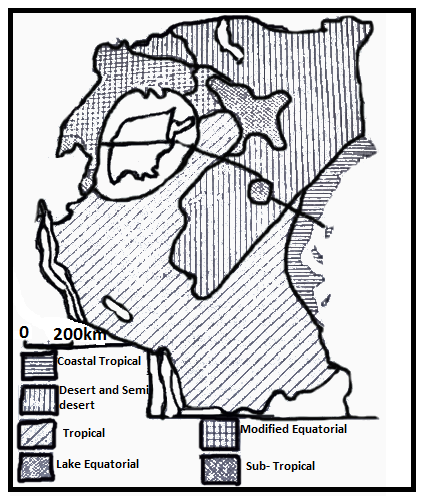
For instance:
Qn. Describe the climate of the area.
ANSWER
Climate of the area being the overall weather conditions as observed from the given extract map is described as follows:-
The area is realized to experience equatorial climate featured by high temperatures with small annual range and high rainfall through out the year.
The realization of climate is supported (reinforced) by the following evidences as observed from the map.
The area is of latitude of 2° indicated along the map edge. Also it is of low altitude. Commonly low latitude sustain high temperature being a feature of the recognized climatic pattern.
Cultivation of cocoa reflects high rains which is also a feature of equatorial climate.
EXERCISE
Qn. With precise pieces of evidence propose the climate of the area shown on the map. (NECTA 2004, map extract of Mwanza sheet 33/2).
Qn. Suggest the possible climate of the area. (NECTA 1993, the extract of part of Tanzania (sheet 162/1).
Qn. Giving evidence from the map, suggest the climate of the area. (NECTA 1987, the extracts series Y 742 sheet 55/3 or ARUSHA).
Qn. Using evidence from the map, suggest the possible climate of the area (NECTA 1989).
Qn. Describe and account for the climate of the area (NECTA 1985, the extract part of Tanzania provide (sheet 55/3 series Y 742).
Qn. Comment on the possible climate of the area. (NECTA 2007, Extract map of West Hai).
Qn. Given topographical map of an area what indicators can be considered in deducing the climate of the area (NECTA 1983).
Qn. Describe how the relief and vegetation can help the map reader to depict climate on topographical maps. (NECTA 1997).
2. VEGETATION
Vegetation refers to a total assemblage of plant cover in an area. Topographical maps show vegetation with reflection to actual areas represented. It is thus; topographical maps may guide map users to realize the vegetation of an area represented.
The forms of vegetation present in East African areas of which commonly shown on topographical maps include the following:-
Forests:- The vegetation of more close trees; or The vegetation largely dominated by dense growth of tall trees with closed leaf cover or canopy. These develop in regions with high annual rains.
Woodland:- The type of vegetation of less closely big trees. These grown in areas with moderately high annual rains.
Thicket :- This type of vegetation is of dense shrubs (closely shrubs) and some scattered big trees. Such vegetation nature commonly found in regions with moderately high seasonal rains.
Scrubs:- The vegetation of less closely shrubs with widely scattered trees. Such vegetation commonly found in areas of annual seasonal rains with long dry season.
Scattered trees:- These are the vegetation of widely spaced trees. These also commonly found in areas of seasonal rainfall.
Planted vegetation:- Theseare more particularly of the cultivated plants (crops) like sisal, tea, coffee, cashew nuts and others.
The appearance of the distinctive vegetation forms on the topographical map is as follows:-
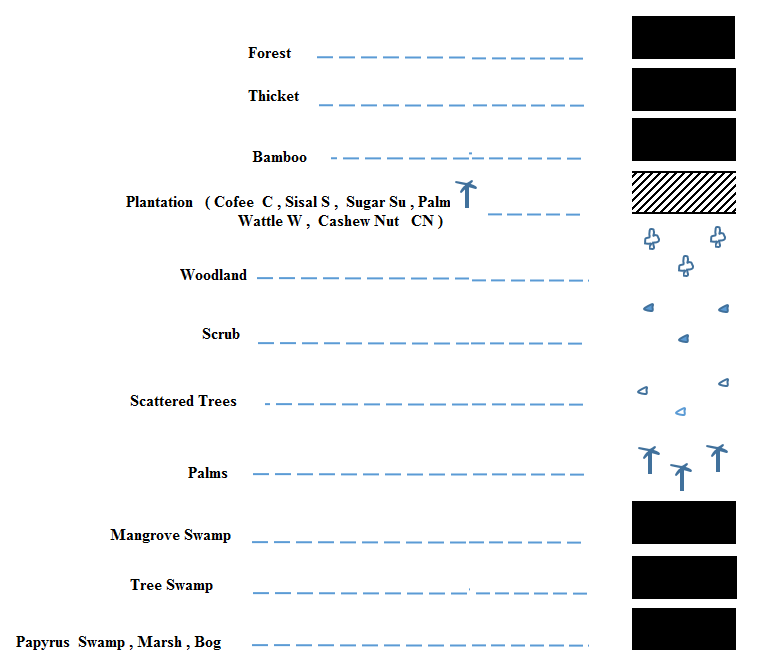
Vegetation on most of the topographical maps and up on the actual areas represented extremely varied in nature and distribution because of the following factors.
Climatic conditions
High annual rains develop forest vegetation featured by the dense growth of trees.
Moderately high annual rains develop woodland vegetation featured by the less closely trees.
Moderately high seasonal rains develop thicket featured by the growth of closely shrubs.
Seasonal rainfall makes occurrence of scrubs and scattered trees.
Relief.
It is considerably the physical appearance of an area. This influences vegetation relatively to soils and drainage as follows:-
Where the landscape is steep as on a map contours observed to lie much closely to one another, drainage is good, but soils can be shallow. This may give to poor coverage of plants.
Where the landscape is almost level as on the map contours observed to lie much more far apart, deep soils develop, but the area subjected to poor drainage. This also may make poor plants growth e.g. areas of seasonal swamps.
Where the landscape is gentle sloped as on the map contours observed to lie far apart, may have deep well drained soil. This may make good coverage of plants.
Soil:-
Soil has ideal influence to plants growth in the following ways:-
Fertile soil by being deep well drained makes good growth of plants. Such soil sustained where the topography is gentle sloped; and on the map can be realized if contours lie less closely to one another.
Poor soil by being shallow, water logged makes poor growth of plants.
Human activities:-
Areas under human utilization like; scattered cultivation and settlements, plants have been removed and thus; subjected to have poor coverage of plants.
It is unlike to areas that not subjected to human utilization, can be observed to have good coverage of plants if other factors are also favorable.
Important vegetation description hits.
To describe vegetation, carefully study the map key to recognize the conventional symbols representing vegetation and relate to map face. After this the following hints can be given.
Identify the types of vegetation shown on the map like, forest, woodland, scrub e.t.c.
Give the distribution of each identified type of vegetation.
Describe the extent of coverage of each identified type of vegetation.
EXERCISE
Qn. Explain the factors that have influenced the distribution of vegetation of
the mapped are (NECTA, 2006. The map extract of Mpanda 153/30).
3. DRAINAGE
Drainage is the removal of surface water from an area by the system of both natural and man made water bodies like of rivers, lakes, swamps, ditches, canals and other related systems. The common drainage systems of areas which normally observed on the topographical maps include the following:-
1. Swamps:-
A swamp is a body of shallow stagnant water that normally occupies an area of flat low lying land. Swamps normally found where the ground forms a shallow depression or is extensively flat. Swamps make drainage by receiving water drained into them by the streams of water flow in wet season.
Swamps are of different types and are shown using different symbols. The swamps are explained in the key of topographical map.
The different types of swamps include the following:-
Mangrove swamp:- These on the topographical maps can only be found along the parts of the sea shore. This is because mangroves only grow in salty sea water.
Tree swamps:- These are the water waterlogged areas which have trees and other smaller plants growing in them.
The papyrus swamps:- These are dominated by papyrus plants.
Marshes:- These are dominated by grasses like plants.
A bog:- It is water logged spongy ground with a surface layer of decayed vegetation.
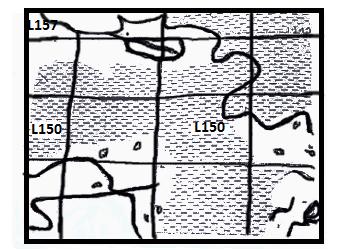
2. Sea:-
It is a large extensive body of salty water. This makes drainage by receiving water discharged into it by rivers. The sea is usually shaded in stipples (very small dots).
3. Lakes:-
These are bodies of water that occupy a basin, depression or hollow on the earth’s surface. They make drainage by receiving water drained into them by rivers and form an important inland drainage system areas.
4. Reservoirs:-
These are the human made lakes which formed when people build dams across streams or rivers.
5. Ponds:-
A pot is a small area of stagnant water which is commonly found along the stream courses. Most of the ponds are shown on the map using a dark blue tint.
6. Waterholes:-
A water hole is a shallow broad pit constructed by people. It is meant to trap rain water for animals to drink. It is shown on the map using the initials WH and a small circle which precedes the initials. i.e. oWH.
7. Ditches:
These are the trenches constructed in water logged areas for the purpose of draining water from the land. On topographical maps are shown by straight blue lines and the word ditch commonly written along side the line.
8. Rivers:-
A river is a mass flow of water in a natural channel from the area of upland towards the area of lowland where is likely to discharge its water.
A river can be permanent or seasonal. Permanent river can be topographical maps shown by irregular blue lines, and if the river is considerably big, the line appears thickened. While; the seasonal rivers are shown by the broken blue irregular lines. It has to bear in our mind that, some places have rivers which disappear as water percolates into the ground. Rivers of this nature on the map shown by continues irregular lines which end abruptly.
Drainage system of rivers occupy patterns depending on how tributaries converge to the main river and the general appearance of both consequent and subsequent streams. Drainage pattern is thus; defined as a layout made by the rivers on the landscape or is the shape produced by the arrangement of tributaries and main-river in a catchment area.
The patterns of rivers is the result of certain determinant factors which include the following.
Slope of the land.
The nature of the underlying rocks.
The general relief pattern of an area.
The common river patterns of areas appearing on topographical maps include the following:-
(i) Dendritic pattern:- It a drainage pattern in a shape of a tree trunk like structure with tributaries converged to the main river at acute angle resembling the shape of a tree like a feature. It develops on landscape of uniform rock hardness and structure and on gentle slope landscapes. It is very common in areas of igneous rocks.
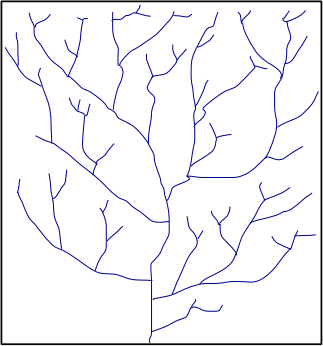
2. Trellis or rectangular drainage pattern.
It is a pattern which occupies a shape of a lattice with tributaries converging to the main river at almost right angle. It develops on a catchment’s area whose landscape has variation in rock hardness and structure. It may also occurs in areas of faulted landscape.
(ii) Radial pattern:- It is a drainage pattern whose tributaries diverge outwards down from the summit of rounded highland to different directions forming a shape of spokes round a wheel like structure. It is common to areas of roughly circular hills of igneous rock.
(iv) Centripetal pattern:- It is the one whose tributaries flow from different directions converging at a center of down warped landscape, where there is a swamp or lake. It is largely controlled by the shape of the landscape
.River course (stage) identification
It has also to be noted that, a river has its course if development marked with three stages of life cycle. The stage of a river on a topographical map can be identified as follows:-
(i) Youthful stage.
It can be easily identified by the presence of the following;
The narrow V – shape contours like arrow heads pointing up to highest ground.
Very close contours along the river course, which represent steep valley sides.
Lack of meanders.
Absence of a flood plan.
Very few tributaries.
(ii) Mature stage:-
It is recognized by the following facts on the map.
Contours have a U – pattern crossing the river at wide interval which represent more gentle gradient.
The landscape is fairly flat with a narrow flood plan on either side of the river.
Presence of many tributaries.
Low degree of meanders.
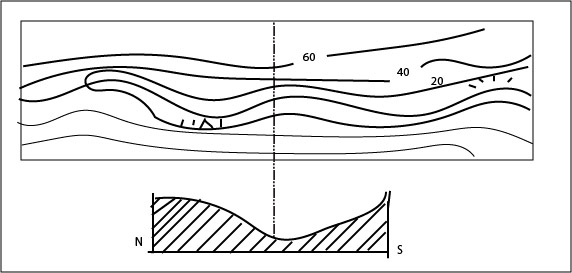
(iii) Old stage.
It is observed by the following facts.
The presence of a very gentle gradient of the river course.
Contours are very far apart cross the river.
More pronounced meanders.
The presence of a river broad flood plain.
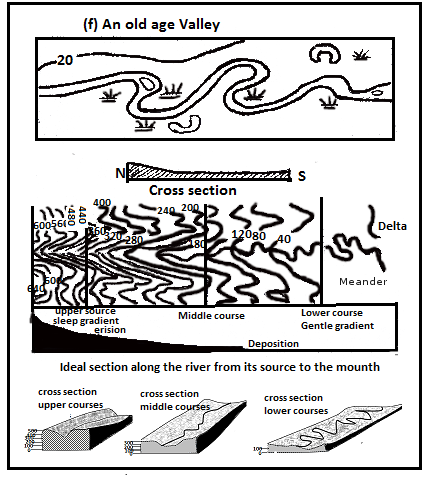
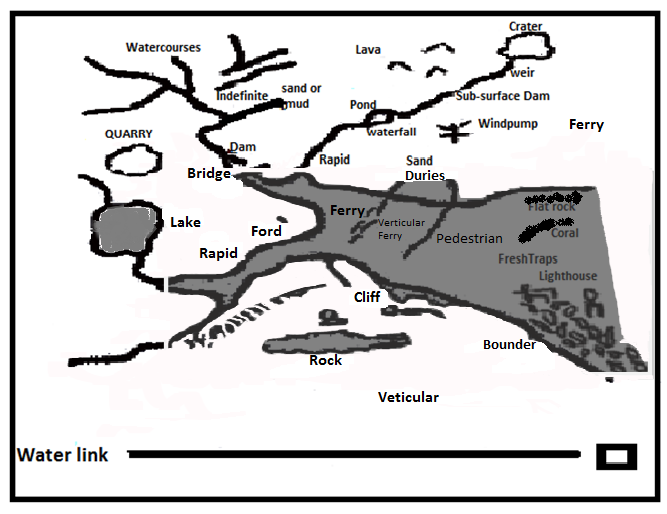
Factors influencing drainage systems.
Drainage systems observed on topographical maps with reflection to
actual areas represented are the result of the following determinant factors:-
(a) Climate.
Occurrence of rainfall, supply water to surface which then development to water body systems of rivers, swamps and others as follows:-
Heavy and continues rains, make areas to have permanent rivers and permanent swamps.
Seasonal rains make areas to have seasonal rivers and seasonal swamps.
(b) The nature of underlying rocks:-
Impermeable underlying rocks influence the occurrence of swamps. This moreover makes rivers to flow steadily regular as water is in difficult to percolate into the ground.
Permeable rocks make rivers to flow irregularly as may end abruptly.
Rocks of uniform hardness influence rivers to develop either dendritic, radial and parallel patterns if other factors remain constant.
(c) Relief / topography.
Sloped topography develop rivers as water make flow from the areas of upland towards the areas of low land.
The extensive flat low lying topography influences the occurrence of swamps as bodies of shallow stagnant water occupying flat low lying areas.
Depressed topography encourages the occurrence of lakes. Moreover, may influence the occurrence of centripetal pattern.
The conical shaped uplands encourage the occurrence of radial drainage pattern.
Important drainage description hints.
When describing drainage of an area from the given topographical map, the following if possible as important hints should be given.
Given the statement in connection to what you need to describe about the drainage of the area from the map.
Identify the main features of drainage in the area as observed from the map. These may include; swamps, rivers, lakes, etc.
Give the location of each feature on the map with reflection to the actual area represented.
Give the characteristics of the identified drainage features like coverage, patterns, direction, seasonality, etc.
For instance:
Qn. Describe the drainage of the area.
ANSWER
Drainage refers to the removal of the surface water from an area by the layout of water bodies.
Therefore, the drainage of the area as observed from the given topographical map is described as follows. The area is drainage systems of river, swamps, and lake.
Rivers; these are the flow of water in definite channels. They largely drain the area particularly the northern part where the landscape is comparatively higher and most of the rivers start to flow towards the southern part where the landscape is comparatively low. The rivers observed to occupy dendritic pattern. Some of the pronounced rivers include of Malela, Kitungwe, Kitogota, Lusingo, Kuga, Mbingu and others which might be present in the area.
Swamps; These are the bodies of stagnant water which are observed to occupy flat low lying lands and in are all seasonal. These observed in the southern part of the area where the landscape with observation to contours is almost level. Swamps in the area make drainage by receiving surface water drained into from rivers.
Lakes; These also make considerable drainage in the area. These observed in south east part where the landscape depressed. The most remarkable lake is that of Mnyamani and make drainage by receiving water discharged into it by rivers.
EXERCISE
Qn. Explain how the drainage pattern of the area is related is related to relief
(NECTA, 1993 …..THE MAP EXTRACT PART OF Tanzania – Dodoma west
(sheet 162/1).
Qn. Comment on the drainage pattern of the area. (NECTA 1995 – the map extract of part of Tanzania – KILWA KIVINJE (sheet 256/2).
Qn. Explain the main factors which have influenced the drainage system of the area. (NECTA 2000, the extract Madukani series Y742).
Qn. Describe the drainage pattern of the area. (NECTA 1987 the map extract
part of Tanzania provided (sheet 55/3 series Y72.)
Qn. Comment on the drainage in the area. (NECTA, 1985 the map extract part of Tanzania provided (sheet 55 series Y742).
Qn. Explain the relationship between relief and drainage of West Hai. (NECTA 2007, the map of WET HI, (sheet 56/1).
Qn. Explain how drainage pattern of the area is related to relief (NECTA 1991, the map extract of part of TANZANIA Fig.1).
4.ROCKS NATURE
Rocks are the aggregate or mixture of materials in solid form contented with minerals. Rocks are extremely varied and popularly include; igneous, sedimentary and metamorphic rocks.
The rocks of an area in exception of the out crop rocks and coral reefs are not directly shown on topographical maps. Rock nature can be identified by taking into consideration of the geographical facts related to geology which commonly shown on maps. These include the following:-
(a) Landforms:-
Land forms are good guide to rock nature identification of an area from a topographical map.
The presence of volcanic landforms on the map.
– Like crater, caldera, conical hills and mountains and others, reveals the igneous rocks of both intrusive and extrusive.
The presence of coral reef reveals the organically formed sedimentary rocks.
The presence of depression, sand dunes, and beaches reveals existence of less resistant rocks of which easily worn out into residuals to form such landforms by accumulation.
(b) Drainage features:-
Drainage features in areas strongly related to the nature of geology. It is thus; consideration of the drainage features may helps to realize the existing geological nature:-
The presence of dendritic, parallel and radial drainage patterns reveals the presence of hard rocks. Commonly such river patters develop on landscape of uniform hard rocks.
The presence of swamps and lake reveals the existence of impermeable underlying rocks which limit the percolation of water into the ground.
(c) Vegetation:-
Certain vegetation much related to geological nature of areas. Therefore; the consideration of vegetation may help to suggest the nature of rock of an area.
The presence of thick forest; and crops of coffee and tea suggest the existence of igneous rocks. It is so as such plants found where the soil is fertile. In consideration, most of fertile soils are derived from volcanic igneous rocks.
The presence of poor vegetation suggests the existence of sedimentary rocks as such rocks have low ability to retain water for plants.
Note:-
Metamorphic rocks have poor indicators (evidence). Probably, the presence of poor vegetation may reveal the existence of such rocks.
5. RELIEF
Relief refers to the physical appearance (surface form) of an area by landforms of contrasting shape and size.
The realization and description of relief of any area from a topographical map is by observing the patterns of contours and their respective heights. The arrangement (pattern) of contours reflects the surface form physical appearance), while the numbers reflect the altitudes.
In common, the relief of the area can be of either highland or low land. The area is recognized to be of high land if is of high altitude above 500m from the mean sea level. Lowland is recognized if the area has low altitude of below 500m from the mean sea level.
RELIEF PATTERNS OF AREAS.
The common relief patterns recognized from the topographical maps and up on the areas represented include the following.
(a) Mountain landscape:-
Mountain landscape is a surface form that rises more steeply or abruptly to summits above the surrounding area over wider area. On a topographical map mountain landscape is recognized, if contours lie so much closely to one another over a considerable wider part. Moreover; the map by contours shows many hills or summits, dissection of rivers (streams), the presence of passes, saddle, water shed and escarpments.
(b) Plateau landscape:-
It is an extensive highland area, generally, level or gentle sloped at summit. On a topographical map is recognized if the landscape is assessed be of high altitude and wider part is almost level or gentle sloped. Thus; the contours observed to show higher height numbers and lie far apart to reveal a general level, and might be dissected by rivers.
(c) Hilly landscape:-
It is an area predominated by numerous isolated hills. On a topographical map is recognized if the contours or roughly round close to one another appear numerous and isolated.
(d) Coastal plain:-
It is an extensive area of low altitude lies immediately after the sea. The lowland Coastal plain is recognized if contours on the map are widely spaced and the elevation rarely exceed above 300m. Beside to this, the mapped area is observed to lie immediately after the sea.
(e) River basin:-
The lowland of a river valley is recognized if the mapped area is observed to lie parallel to the big river and the contours show low height numbers.
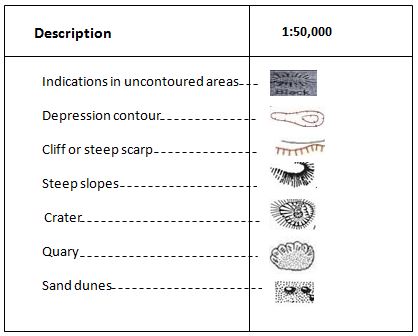
Important relief description hints.
Generally, in making description about the relief of the mapped area, the following hints should be followed.
The map has to be divided into relief regions. This is done by observing contrasting contour arrangements.
Give the position location of each relief region as shown on the topographical map.
Give the general description of each relief region by giving out the prominent landforms and altitudes of each region.
EXERCISE
Qn. Describe the relief of the mapped area. (NECTA 2002, the map of part of
KENYA – NYAKWERE).
Qn. Describe the relief of the area shown. (NECTA 1996, the map extract Y742
55/3 or ARUSHA (reproduced from the same series).
Qn. What type of landscape does the map depict?
(NECTA 1995, map extract of part of Tanzania – KILWA KIVINJE (sheet
256/2).
Qn. With specific evidences on the map, suggest the landscape patterns that
predominate in the area.
(NECTA 2003, the map extract of SONGEA sheet 299/1).
6. GEOMORPHOLOGIC PROCESSES.
Geomorphologic processes refer to the natural activities (physical processes) which mould an area by resulting into the occurrence of landforms. Geomorphologic processes moulded the area from the topographical map, realized and suggested by taking into consideration of the following.
(a) Land forms.
The presence of volcanic land forms such as craters, caldera and volcanic hills and mountain reflects vulcanicity.
Presence of block Mountains reflects crustal uplift by earth’s movement.
The presence of escarpment reflects both faulting and denudation.
Presence of sand dunes, delta, beach, flood plains and levees reflects deposition.
(b) Drainage.
Presence of rivers and lakes suggests erosion and deposition provided the formed related features observed on the map.
Presence of oceans reflects marine erosion and deposition provided the related features such as cliff and beach respectively observed on the map.
7. COMMUNICATION.
Communication in most of areas is enhanced by the means of transport and telephone networks. Hence on topographical maps communication is recognized up on the presence of the means of transport, telephone lines and telephone towers.
FORMS OF TRANSPORT
The topographical maps may show one or more forms of transport with reflection to areas represented. These include the following.
1. Land transport;-
This form of transport is by road, tracks, railway lines and foot path.
(a) Roads:- These are of the varied nature and include the following:-
All weather road bound surface. They are tarmac roads and normally used throughout the year including during the rainy season.
All weather road loose surface; they are murram surface road and also used throughout the year.
Dry weather road; These are also murram surface roads, but
(b) Footpath:-
These are the ways through which people move from one area to another on foot.
(c) Rail transport;
It is reflected by the presence of railways; and these may appear on the
topographical map provided the represented area is served by this particular means of transport, or the railway line pass through the area.
Railway lines as observed from the topographical maps with reflection to areas represented, are of two categories and include the following.
Main railway lines; These on the topographical maps represented by the black shading which alternate with white ones.
Light railway lines: These are normally present with in plantation and mining areas. These are represented by the thin black lines which may be pecked.
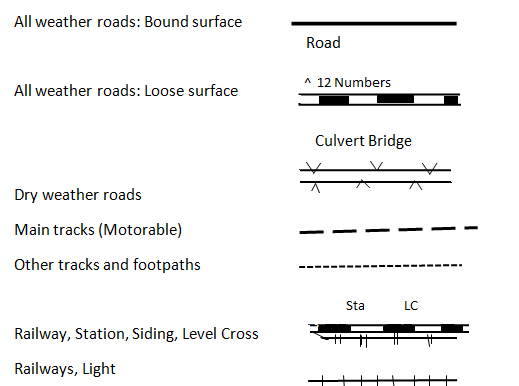
2. Air transport
Air transport about areas can be realized if the following observed on the topographical maps
(a) Air port. This is a large area on the ground which is used by commercial airlines to land or to take off. It has facilities for passengers, goods and offices including of immigration.
(b) Aerodrome. This is small airport that is mainly used by private air craft.
(c) Airfield. This is area of open and level ground where aircraft may land or take off. These normally have offices for air craft operations. However; the offices are not as large those of air ports. Airfield runway can be bound , murram or grass

3. Water transport:-
Water transport on the topographical map with reflection to the area represented is revealed by the presence of ports, big lake, sea and ferry across the river, lake or part of the sea; wharf, berth, jetty and pier.
Wharf is a wooden or stone structure that is constructed at the water front onto which boats or ships are tied when they are being loaded or off loaded.
A berth is the space on the side of the wharf which is set aside for a ship to anchor.
A jetty is a structure that is built out into the water for breaking the waves. This keeps the water calm on the side of the land. It may have also serve as a landing place.
A pier is a structure which is made of wood, iron or stone. It is built out into the lake or sea for walking on and for ships to stop and load or unload. Pier is bigger than jet and may have restaurant on it.
FACTORS INFLUENCING TRANSPOTATION.
It has to be noted that; types, layout and quality of the means of transport as observed on maps with reflection to the actual areas represented influenced by the following factors.
1.Relief.
Relief being the physical appearance of an area influences both; layout and types of transport as follow.
Roads and railways avoid to pass through areas of steep slope and are more liable to pass through areas of gentle slope. Thus; the layout of the overland transportation is observed in areas of gentle slope as such areas are less expensive for construction and also less hazardous.
However, roads have more advantage than railway in this respect as motor vehicles can travel more easily uphill than trains.
2. Drainage.
Roads and railways avoid to pass through areas with many rivers and very flat areas liable to floods. It is hazardous more expensive to establish means of transport through areas of this nature.
3. Economic activities.
Means of transport are made to pass through the areas where economic activities are carried out to facilitate the carriage of the economic goods.
4. Settlements
The layout of roads and railways is observed in areas where human settlements exist to facilitate the movement of people as well as their goods.
In urban areas; air transport observed and other means transport of high quality. It is unlike to rural areas.
Important transportation description hints.
To interpret communication, some one has to study carefully the map key to detect the convention signs representing means of transport and relate them to a map face and the following hints can be given.
Give the statement in connection to what you are going to describe about the area from the map.
Identify the main means of transport in the area as observed from the map. These may include; land transport, air transport and water transport.
Give the characteristics of the identified means of transport like; layout, quality and others.
EXERCISE
Qn. With reference to the relief and settlement pattern of the area, account for the type, lay out and quality of over land transportation. (NECTA 2006, the map extract of Mpanda sheet 153/3)
Qn. Describe the nature of transport as seen on the map (NECTA, 1997 – the map extract of MOSHI series Y742).
Qn. Explain the communication of the area and show they are influenced by physical features. Comment on how the communication might be developed to meet future needs. (NECTA 1980, the map of TANZANIA – MINGOYO Serial Y742 sheet 295/1 Edition 1 TSD 1967).
Qn. Relate settlement distribution and communication lines to relief and drainage. (NECTA 1985, the map extract part of Tanzania provided (sheet 55/3 series Y742).
Qn. Comment on the transportation system of the area 56/1.
8. SETTLEMENTS.
Settlement is a layout of dwellings in the habitable area where people live and conduct their social and economic activities by interaction with the prevailing environment.
A good number of topographical maps show settlements so long they represent areas in which people dwell.
Settlements on the topographical maps are given by means of selected conventional symbols.
There are two type of settlements which commonly shown on the topographical maps and these include; rural and urban settlements.
Urban settlement.
Urban settlement is commonly found in areas of the following nature.
District administrative centers.
Regional administrative centers.
Capital city of a country.
Areas with transportation system junction.
A good number or people approximated to over 80% in urban areas engage in non-agricultural activities mostly trade.
On the most topographical maps; urban settlements realized by the presence of the sign indicating the built up area.
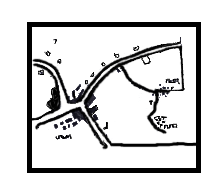
Rural settlement
Rural settlement is in areas where the majority of people approximately to over 80% engage in agriculture shown by means of the black round dots. Thus; on topographical maps rural settlements realized by the presence of the black round dots.
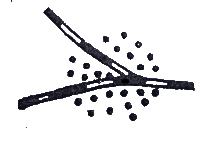
SETTLEMENTS PATTEERNS
The signs showing settlements on topographical maps are observed to have varied arrangement. With respect to this, settlements on topographical maps and up on the areas represented recognized be in varied patterns. The most common patterns include the following.
Dispersed pattern.
It is alternatively called scattered settlement pattern. The houses are widely spaced one to another. It is very common in areas of the following nature:-
Scattered cultivation.
In areas where the individuals farms are large enough and population is too sparse.
Pastoral societies.
Newly established settlement area where the houses are few and thus may lie far apart.
Evenly distributed of water sources. This makes settlement put in any suitable place.
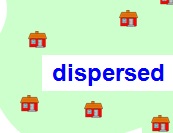
Nucleated settlement patterns:-
Houses and other related forms are compacted to one another. On the topographical maps, it is identified where the round black dots lie clustered or where black block lie in a specific area. This pattern is common in areas of the following nature.
Urban areas where people more concentrated.
Planned villages.
Where there is a single supply of a certain economic resource and every is one is on need of it.
The presence of economic factors like, industrial plants, mineral exploitation, plantation, and rich agricultural land.
Presence of the social amenities like; health and education.
Limited supply of water sources and this make people to stay very closely to it.
Limited spacing for building due to natural and artificial restrictions. This makes people concentrate in available small space as a result settlement becomes clustered. e.g. Relief barrier which makes people to concentrate in a small area of more less hazardous areas.
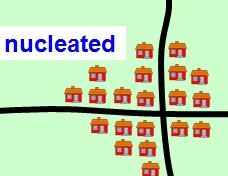
Linear settlement pattern
It this pattern, the dwellings are concentrated along an elongated object of economic significance like; a road, a river, a railway line and others.
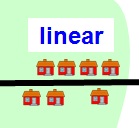
To realize and describe settlement, map user should be in position to observe the type of map symbols or sign that represent settlements.
On most of topographical maps as it has already been given; round black dots represent rural settlement; where as rectangular or square signs represent built up area like that of a town or a single building like market.
The way in which symbols and settlements are distributed on the map and up the area represented, is due to the many factors. Some have encouraged settlements and others discouraged.
Factors encouraging settlements.
A reliable source of water supply. E.g. the presence of permanent rivers, lakes, dams, ponds, wells, or bore holes on the map. These are mainly used for domestic purposes as well as irrigation.
Good soils for agriculture. This favours the cultivation of crops.
Pleasant climatic conditions, which can be favouring kinds of crops cultivated and natural vegetation.
Gentle slopes. People mostly prefer to establish settlements in less hazardous areas. Hence settlements are likely to be observed where the contours are reasonably wide apart, but not so wide apart. Gentle slopes provide a suitable gradient for the construction of means of communication and homes. More importantly soil erosion and mass wasting are less common.
Transport and communication. Transport routes and especially roads, attract large settlements along side them. These largely ease the movement of people as well as their goods to else where of interests.
Social amenities. Settlements tend to increase where amenities such as health and education exist. With respect to this, on maps there is high concentration of dots where the amenities exist.
Factors deterring settlement.
Marshy or swampy areas. Usually symbols for seasonal or permanent swamps will be printed on such areas. More importantly the contours are very wide indicating flat lands liable to floods.
Steep slopes. Steep slope give difficulties for road and railway construction. Erosion may be common and growing of crops is also difficult steep slopes on maps recognized if contours lie so closely to one another.
Reserved area. These are the areas where a settlement is prohibited by law. These are known as government lands and reserved for national parks, games reserve or for future government plans. On the maps indicated in words.
Unpleasant climatic condition. e.g. prolonged drought. This gives difficulties to cultivation of crops and water supply for domestic use and other purposes.
Lack or shortage of water supply.
Lack of the social amenities, transport and others.
FORMS OF POPULATION DISTRIBUTION.
Because of the factors, population distribution as observed on maps and up on the area represented is not even and makes varied forms related to is including the following.
Densely distributed settlements.
An area is described as being densely settle, where there is a high
concentration of settlements. On the topographical map, dense settlement are indicated by high concentration of dots or blocks of black squares. It is therefore where the concentration of dots appears very high, the population is described being very dense.
Moderately distributed settlements.
An area is described as being moderately settled, where the number of dots is moderate in quantity. i.e. Note very many and not very few.
Sparsely distributed settlement.
An area is sparsely settled where a few dots are spread over large area. It is therefore, where the dots are very few; the distribution of the settlement is described as being very sparse.
Important settlements description hints.
Give the statement in connection to what are you need to describe from the map about settlements.
Indentify the main types of settlements in the area as observed from the map whether rural, urban or both.
In each type give the distribution, patterns and if possible the influencing factors.
For instance:
Qn. Describe the settlement of the area
ANSWER:
Settlement of the area as observed from the given extract map is described as follow.
The area has both urban and rural settlements.
The urban settlement observed on the eastern part of the mapped area where the area is heavily built up and form nucleated pattern. The location of this is assessed to have been influenced by the gentle topographical reasonable, lay our of transportation systems and the presence of so many social amenities like health.
Rural settlements make mostly case in the area. These observed almost every where in the mapped in exception of the eastern side.
However, rural settlement observed to occupy two patterns of nucleated and scattered. Nucleated is much observed in the northern and southern parts due to availability of social amenities and the presence of gentle topography.
Sparse settlement pattern observed in the central part due to the presence of scattered cultivation.
EXRICISE
Qn. Using the map extract given write short notes on:-
Settlements. (NECTA 2005 – the map extract of Musoma sheet 12/2).
Qn. Give account on population distribution of the area (NECTA, 2006 – the
map extract of Mpanda sheet 153/3).
Qn. Explain how the sites of some towns and villages and water south of 10 05
South are related to relief and water supply. (NECTA 1980, the map extra
part of TANZANIA MINGOYO.(Series Y742 sheet 295/1 Edition 1 – TSD
1967).
9. HUMAN ACTIVITIES
Human activities are of two categories and include:
Social activities.
Economic activities.
Social activities
Social activities include the ones conducted to meet social motivation like; education, medical care, security, entrainment and others. etc. The identification of these activities from the topographical map is as follows.
Education; Identified by the presence of schools, collages, education centre etc.
Worship; It is identified by the presence of church, mosque, mission schools and others which reveal the same.
Health care; Identified by the presence of hospitals and dispensaries.
Entertainment; It is identified by the presence of clubs, res house, hotels, motels and others which also the same.
Security; It is identified by the presence of police station or police post, military camps, prisons and others of related.
Economic activities.
Economic activities are the ones conducted by people for purpose of earning livelihood. These are for income earning to improve economic growth of an individual or society as a whole. Economic activities include; trade, tourism, mining, manufacturing industry Pastoralism, crop cultivation/agriculture and others.
Topographical maps have much that involves the development and exploitation of woods from green resources of forest. On the topographical maps,economic activivties can be identified by the presence of the following.
1. Lumbering
Lumbering is an economic activity that involves the development and exploitation of woods from green resources of forest. On the topographical maps, lumbering can be identified by the presence of the following:-
Saw mills; these are for processing of woods.
Forests, the natural resources from which wood exploited.
Minor roads ending into the forestland, these established purposely to transport logs to saw mills.
2. Crop forming.
It involves the development and cultivation of crops. It is the one of the basic and most widely spread human activities in Tanzania, East Africa and else where in the world.
Crop forming in the area with reference to the topographical map provided. Can be identified by the presence of the following:-
The directly shown large scale farms (Plantation), on the map e.g. sisal estates, cashew nuts plantation etc.
Rural settlement in a basis that, over 80% of people dwelling in rural areas engage more directly in agriculture.
If the area is assessed to experience suitable climate conditions for crops cultivation e.g. reliable rainfall.
Presence of water bodies like, rivers, dams which can support irrigation agriculture.
Presence of crops processing industries like; ginneries, decorticators and hulluries.
3. Livestock keeping.
Livestock keeping is among the human activities which based on domestication of animals of like; cattle, goats, sheep etc. on a topographical map, livestock keeping can be identified by the presence of the following:-
Grassland with scattered settlement as people in grassland areas engage in animal keeping as their reliable source of earning livelihood.
Presence of ranches and diary farms.
Veterinary centers. These are the stations in which treatment and vaccination given to the domesticated animals. They are commonly established in areas where live stock keeping is conducted.
Dams and bore holes. These have been constructed in many areas for domesticated animals.
If the area is assessed to experience aridity condition and there is the presence of scattered settlement. In consideration on arid areas crop farming is of difficult and thus, people earn lively hood mostly by engaging in animals keeping.
Cattle markets. These commonly established in areas where animal keeping is conducted.
4. Mining and quarrying
Mining involves the development and exploitation of minerals from the ground and other sources. The activities from the topographical map can be suggested by observation of the following.
The presence of the conventional signs indicating mineral works. Usually signs for minerals works are interpreted in the map key.
Sometimes, the presence of lakes in valley may guide you suggest the activity due to the fact that, such lakes are exploited for salts and soda.
Presence of quarries.
5. Fishing.
Fishing activity involves the development and exploitation of fish from the water body systems of rivers, lakes and ocean.
From the topographic maps, finishing is suggested by the presence of the following.
From the topographical maps, fishing is suggested by the presence of the following.
Small settlements along the coasts of sea, lake and large rivers. It is so as lakes, rivers and seas provide good basis for fisheries. Beside this, people living along the water courses are fishermen oriented.
Presence of fish ponds, fishing cooperatives societies, fishing colleges, fishing villages etc.
6. Manufacturing industries.
These are the activities which involve the turning of organic, inorganic, refined raw materials by chemical and mechanical means into new products. On topographical maps manufacturing industries can be observed by the presence of the following.
Factory special symbols which indicated on the map interpreted in the map key.
Presence of township characterized by having high concentration of transport networks of road railways. It is so as manufacturing industries follow urban centers to have accessibility to markets, transports, and labour supply.
Presence of industrial area as directly shown on the map.
7. Trade.
Trade is an exchange of goods and services. Trade can be identified by the presence of the following:-
Township as the majority in towns engage in non agricultural activities including trade.
Transport network of roads and railway together with settlement. These normally facilitate the movement of people for trade purposes, and also facilitate the exchange of goods and services.
Presence of other economic activities.
8. Tourism.
Tourism is suggested by the presence of the following.
Historical sites like museums indicated by some signs on the map.
Attractive landform such as craters, mountain, beaches etc.
Hotels, motels and rest house, recreation centes.
Presence of national parks, game reserve and forest reserve
TOPOGRAPHICAL MAP INTERPRETATION
INTRODUCTION TO A MAP
What is a map?
Map is a scaled conventional representation of the whole or any of the earth’s surface on a flat body.
Or
A scaled conventional visual representation usually on a plane surface of a region of the earth.
Flat body into which maps, established include, a piece of paper , blackboard, wall, wood, cloth and others of the same consideration.
Maps are the most valuable and powerful equipments in Geography as used for providing geographical details of varied areas represented. They are geographical details of varied areas represented. They are also used for storing the geographical details of areas represented. Some of the geographical facts which can to depicted by maps about areas represented include; climate, relief, human activities, soils, drainage system, vegetation, settlement, settlements, communication and others of similar consideration. It is thus; maps are so useful for making geographical facts description about the respective areas represented. Other useful tools apart from maps which also enhance geographical studies; graphs, globes, globes, ground photographs, aerial photographs and the satellite images.
CATEGORIES OF MAPS
Maps used in geographical studies are extremely varied and belong to different forms. They are classified by considering the following categorizing factors.
- heir varied functions
- Scale size used
- The degree of accuracy
Maps according to functions
Classification by function, it is taken into consideration of what a particular map shows. Maps portray varied geographical facts and thus are of different functions depending on what shown. With respect to this, map are broadly categorized into four and include the following.
(a) Topographical maps
(b) thematic maps
(c) Statistical maps
(d) Cadastral maps
TOPOGRAPHICAL MAPS.
The maps are named with the world ‘topography’ which has been derived from a Greek world of ‘Topos’ The word topos means the actual appearance of a place by its natural and artificial features.
Or
. The map which has been designed to give a general future (description) of the landscape of a very limited part of a country by showing both natural and artificial features.
Or
Map whose principle purpose is to portray and identify the features of the earth’s surface as faithfully as possible with in the limitation imposed by scale.
Topographical maps considerably to their future of function are also known as general maps.
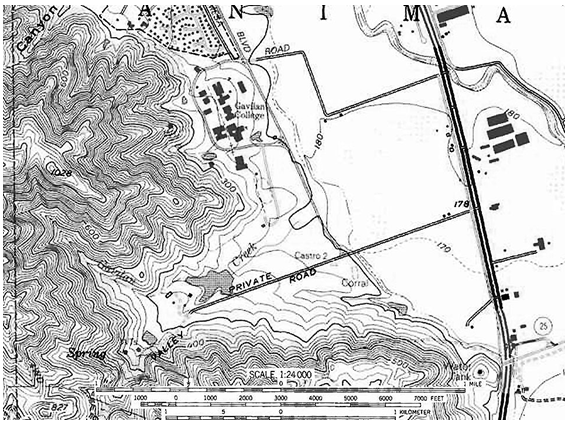
Characteristics of topographical maps
- Show both natural and artificial features of areas represented.
- They are drawn on their medium or large scale depending on the size of the area represented.
- Represent small or limited parts of a country
- They are more detailed as represents small parts on large scale.
Thematic maps
These are the special maps which concentrate on showing the spatial distribution of a single geographical phenomena among the several of areas represented.
Or
Types of map especially designed to show particular theme connected with specific geographical areas. i.e. they show the distribution of only one geographical fact among the several of a particular region. These can portray physical, social, political, economic, or any other espects of a city, state, region, continent and world at large.
Thematic maps are differently named according to the nature of content (details) of an area represented and include the following:-
- Relief maps:- These show the physical appearance of areas represented by giving the major land forms.
- Political maps:- They show political boundaries of administrative for regions represented.
- Geological maps: The maps concentrate on showing the geological nature for the regions represented.
- Soil maps: The ones which show the spartial variation of soil nature for areas represented.
- Economic maps: These show the spatial distribution of chiefs crops, animals, industries, minerals and others.
- Historical maps: show the distribution of the historical sites.
Statistical maps.
These are the geographical maps which show the distribution of certain geographical phenomena in values of phenomena of interest in geographical studies lie temperature, population density, movement of goods or people and others of related. With the use of statical maps, one can make quantitative analysis of a phenomena for the area shown on the map.
Statistical maps are further differentiated by considering the means used to show the values of distribution on the map face. Owning to the consideration, statistical maps include the following:-
Isopleths maps.
These statistical maps which show the distribution of a certain geographical phenomena in quantitative manner by of lines. The lines are established on a map face to join points with equal amount of distribution with reflection to an actual area on the earth’s represented.
The used lines have special names depending on a nature of phenomena shown on the map.
- Isohyets: for rain fall
- Isotherms: for temperature
- Isobars: for atmospheric pressure
- Isohaline: for salinity
- Isobaths: for ocean depth
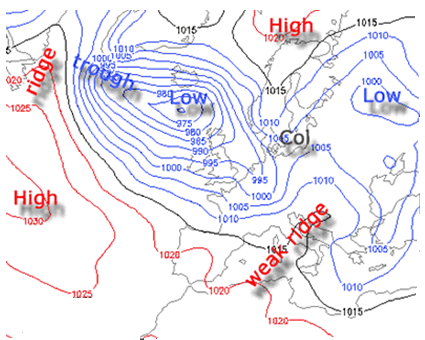
Dot maps.
Such statistical maps designed to show values on spatial distribution of a certain geographical phenomena by means of fixed size dots as inserted on a map face. Each dot on the map carries equal values similarly to others.
Choropleth maps.
These statical maps are designed to show values on the distribution density of a certain geographical phenomena like that of population by means of varied shade texture. The map is established to have a key to interpret the categories of quantitative values represented by the varied shades.
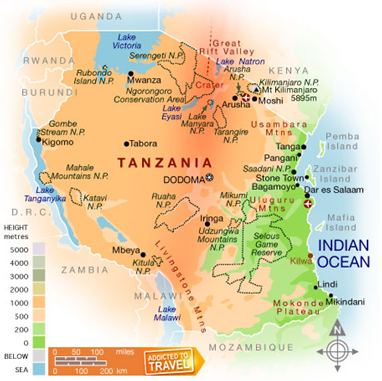
Flow line maps:
These are designed to show the quantitative values on movement of certain geographical phenomena like passengers or goods from one place to another through an established route way of like: a d, railway, water way and others by means of flow lines of varied width. i.e. the amount on movement reflected by the width of the flow lines.
Cadastral maps
They are the maps of large scale which show more Clearly the layout and boundaries of features of a very small size represented. i.e. The maps show precise locations and names of the features of the area represented.
Cadastral maps are mostly designed for ownership purpose. These maps may show the layout of features in a village, part of a town, industrial area, school compound, home steady and others of the same reflection.
Cadastral maps are commonly designed after the boundaries of the features in the area to have been accurately surveyed. The type of survey that concentrates on taking the actual measurements of features boundaries is known as cadastral survey. It is thus the maps are named in basis of the technique used to get details that appear on the map.
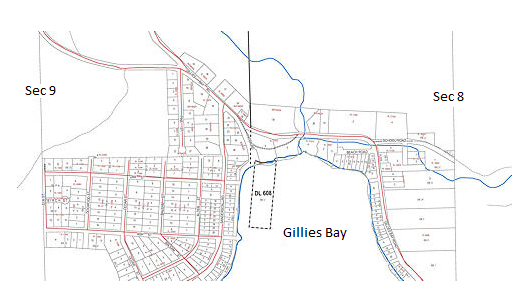
Maps according to scale size.
Maps being much smaller in size compared to actual areas represented, are precisely designed up on distances to grounds represented. However the maps size of the ground and amount of details shown, Being drawn up on varied scale size, makes maps appear extremely varied and this becomes another important categorizing factor of maps. It is thus, maps according to scale size categorized into the following types.
- Large scale maps
- Small scale maps
- Medium scale maps
Large scale maps.
These are drawn on large size to give larger representation of limited parts of a country like a town or village. These commonly established on large spaces of flat bodies.
Characteristics of large scale maps
- They are drawn on large scale size e.g. 1:10,000, 1:20,000 etc.
- The maps give larger representation of areas portrayed.
- They represent very limited parts of the country
- They are more detailed.
Small scale maps.
These are the geographical maps drawn on small scale representing larger area size of the earth’s space of the body.
Characteristics of small scale maps:
- They are drawn on small scale e.g. 1:1,000,000, 1:10,000,000 etc.
- The maps give smaller representation of the areas of the earth’s surface.
- They commonly represent very huge parts of the earth’s surface like a country, continent or the whole of the earth’s surface.
- The maps are more selective and thus, show less details of represented due to the limitation of map space.
Medium scale maps.
These are the maps drawn on medium scale size to represent parts of the earth’s surface.
Characteristics of the medium scale maps
- They are drawn on the medium scale size E.g. 1:100,000,1:25,000,1:150,000 and others of the same consideration.
- Both the map and ground represented are of medium size.
- The maps show moderate level of details.
Maps according to degree of accuracy.
Cartographers try to their level best to make maps most accurate in order to reflect the reality of areas portrayed. They employ varied techniques to make maps be of reasonable accuracy, However, with respect to this consideration, some maps are made accurate, while others not accurate and thus: maps differ in the degree of accuracy and this also taken as maps according to the degree of accuracy broadly classified into two types and include:
- Outline maps
- Accurate maps
Outline maps.
These are the simple maps which not accurately designed as drawn not up on scale. They are commonly shown in text books to make simple illustration of the geographical facts. Moreover, they are commonly printed or copied for personal or classroom uses.
Accurate maps.
These are the ones which have been precisely designed as drawn with the use of correct measurements of the area, its features as well as the map itself. i.e. the maps accurately designed with up on scale. Commonly on the map, the represented area and the features made to have correct size.
Accurate maps are subdivided into two depending up on the technology used o maintain the accuracy.
Surveyed maps.
These are the maps made accurate taken by actual measurements on distance, area represented. Most of the topographical maps correspond to this category.
Project maps
These are the maps which show the accuracy of the earth’s surface curvature (spherical shape) on their faces maintained by the cartographic technique of projection.
USEFULNESS OF MAPS
- Maps provide good basis for making orderly geographical facts description of regions represented. i.e. The geographical facts of an area such relief, drainage, settlement, communication,vegetation and others easily recognized and described from the topographical map.
- They provide ideal insight into significant relationship between geographical f variables. I.e. They are considered to establish the relationship between the geographical variables . E.g and soil,relief and vegetation, climate and vegetation etc.
- In connection to above point, maps are so powerful tools for making spatial analysis of geographical facts for areas represented. i.e. from map , the determinant factors for spatial variation of geographical phenomena detected.
- They are so potential for field studies.
- Maps are useful for traveling purpose. They guide people to reach points of designation· Maps are useful for locating the position of geographical features .It is achieved by a wide range of methods mostly, grid reference, place naming the use of latitudes and longitudes bearing and distance.
- Maps make storage of the geographical facts of areas represented. Hence the give insight to the previous appearance of areas.
- Maps can be used to make quantitative analysis of certain geographical facts like size, distance, gradient, drainage density in response to scale consideration.
- Maps are used for military purpose. i.e. they used to develop military strategies by providing vital details to military troops.
- Maps are used in the conduct of a wide range of projects like: population census, land use planning, building design, construction of roads and others of the same reflection.
SET BACKS OF USING MAPS.
- Maps are convention, and thus do not give the morphology of features represented. Features on maps appear by means of convention signs, symbols and abbreviations.
- Maps are selective. It is not possible for all details to appear on the map. Hence: with the use of maps in geographical studies, we lack some of the details.
- The features shown on the maps may not be all maintained on a constant scale. It is thus, uses may get distorted measurements of the features from the map.
- Maps may provide the outdated details about the respective areas represented. It is automatically set as details in actual areas may change with time while maps once designed remain unchanged. Moreover, it becomes difficult to update the map that has already been designed.
- The reading and interpretation of maps needs high and perfect skill.
- Maps are not capable to record and keep instant data
EXERCISE
Qn. Briefly explain any five merits of such topographical map to a map user (NECTA 2000 – The extract map of madukani series 742)
Qn. Outline the strengths and weakness of using topographical maps in geographical studies. Mock –
CONTENT OF MAPS
Map content refers to a body of information inserted on a map with reflection to the actual area represented. i.e. the details shown on a map which reflect the nature of the area represented or what generally contained on the map.’
The content established on topographical maps are so varied and thus ; classified into three categories of the following:-
- Natural contents:-The features which are distinctive from man made. They include: relief features, drainage features, vegetation features and others.
- Artificial contents: These are considerably to the features of man made such as cemetery, roads, railways, settlements, airfield and others of the same reflection.
- Supportive contents: These are the marginal details established to make well defined. Some of the supportive details include: scale, heading, key, date of compilation, northern direction and others of the same reflection.
FACTORS WHICH DETERMINE CONTENT OF MAPS
Most of the maps do not show (have) similar content i.e. details are considerably varied from map to maps. For instance: a map of Africa observed to show political boundaries of the countries, while the other shown physical appearance of the continent. Moreover: a map may appers more detailed; while the concluded that, variation of details on maps occurs as functioned by certain of details on maps occurs as include the following:-
- Objectivity of the map drawn
- Scale size of the map used
- Date of compilation
- The nature of the area represented
- The nationality of the cartographer
1.Objective of the map drawn
This largely depends on the aim of the cartographer (map maker). Usually maps are selective as it is difficult for all surface details to appear the map. Hence any map reflects its purpose.
2.Scale size of a map used
Maps are drawn on varied scale size depending on the size of the ground and size of the map it self. It has to be taken into consideration that, scale size of a map is what determines the amount of details of an area to be shown on the map, in common, a map drawn on a small scale is made to have limited space and less details would have been shown on it. Conversely to a map drawn on large scale , is made to have large space and very possible to display a lot about the represented area.
3.Date of compilation
Date of compilation refers to a period of time when a map was designed. It has to be taken into consideration that, land details are dynamic over time. With respect to this, a map is likely to show details which were present by the time of its designation. It is likely to have variation in details.
4.The nature of the represented area
A map shows what is found in the represented area and not otherwise. Therefore, maps which details.It is thus, a map reflects the reality of the area represented.
5.Nationality of the cartographer.
A map to represent part of the earth’s surface can be constructed by the foreigner or local cartographer. The two maps may differ in content due to the fact that, the foreigner cartographer might not to include some surface details because of being not familiar with the area. Moreover the foreigner cartographer may misname the places on the map of the region represented.
EXERCISE
Q. (a) What factors affect the content of topographical map?
(b) Classify the features that are commonly shown on topographical maps. (NECTA 1991)
Q. Explain the factors that affect that affect the content of topographical maps. (NECTA 2008)
CARTOGRAPHY
Cartography is an art or a science of designing a map to represent either the whole or any part of the earth’s surface in scaled and conventional form.
There are noticeable contrasts between maps and the whole or parts of the earth’s surface represented as follow:-
·Map is flat, while the earth’s surface or part of the earth’s surface is not flat.
· Maps are much smaller in size, while the whole earth or a part of the earth represented is much larger in size.
With this the map makers use a cartographic technique to maintain the accuracy of the earth’s shape and size on maps. The technique is known as map projection. It is thus; the cartographic technique is associated with map projection. It is thus; the cartographic technique is associated with map projection as a sole means of maintaining accuracy of areas on maps.
MAP PROJECTION
The earth’s surface can be wholly represented with reasonable accuracy on a globe. But globes are not as convenient as flat maps to use. Globe can not depicts much details like transportation system of a city, or the location of very small towns or villages. With this, maps have to be produced to facilitate geographical studies.
To make the maps so accurate, a cartographic technique of map projection is defined as the cartographic technique of transforming the shape of the earth’s surface or part of the earth’s surface more accurately to a plane surface to develop a map that can be easily worked with less distortion. i.e. It is the cartographic technique of maintaining the accuracy of an area on a map.
The cartographic technique of map projection is recognized be of varied types as flat bodies into which maps developed differently projected. This develops cylindrical, conical and plane map projections
The cartographic technique of map projection is recognized be of varied types as flat bodies onto which maps developed differently projected. This develops cylindrical,conical and plane map projections. More over;on a map, the features are made to have accuracy on different respects. This also develops the types of azimuthal, gnomic and stereo graphic map projections.
Cylindrical projection
By cylindrical projection, the shape of the earth’s surface is accurately maintained as a frat body onto which a map would be drawn, projected to a shape of the earth’s surface is maintained and then the cylindrical projected body is cut to develop flat map onto which the whole earth surface appears.
Cylindrical projection is alternatively known as mercators projection.
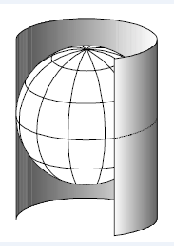
Conical projection
It is a considerable form of map projection, by which, the shape of the earth’s surface is accurately maintained as a flat body onto which a map would be drawn is projected to a conical shape. Over the surface of projected conical body, the shape of the earth’s surface is maintained then the conical body is cut to develop a flat map onto which the whole earth’s surface or part of the earth surface appears.
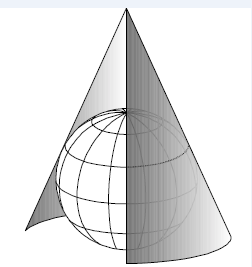
Plane projection
By plane projection, the area particularly of a limited size whose accuracy is directly maintained on a flat body os a piece of paper.
Azimuthal projection
It is a type of map projection which mostly used to maintain the correct distribution of the surface features on a map by being maintained in true directons and distance relatively to one another with reference from the centre of a map and up on the actual area on the earth’s surface. By this, all bearings are laid off correctly from the central point of the map, so that all points on the map and up on the area on the earth’s surface are true in distance and direction from the centre.
Gnomic projection
It is alternatively known as equi-distance projection. This is used to maintain the accuracy of ground distances on the map with respect to the used scale by regarding the relative bearing of the features in the area.
Streographic projection
It is a cartographic technique of preserving the correct shape of earth’s surface features on a map. Preservation of the features is maintained by taking into consideration of the satellite images and aerial photographs.
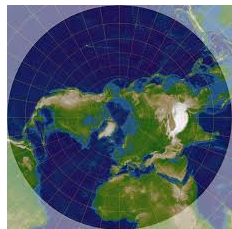
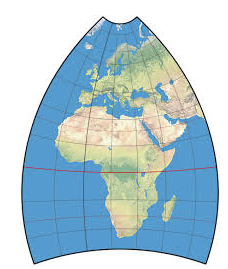
FACTORS INFLUENCING CARTOGRAPHIC PROCESS
(KEY ISSUE CONSIDERED IN MAP MAKING)
I n a process of map making a present a certain part of the earth’s surface, the following should be taken into consideration as guides to map maker.
- The size of the actual area to be represented on a map. The size of the area is revealed by making survey or by examining the vertical photograph that represents the same area.
- Size of the plane surface of a piece of paper onto which a map would be designed.
- ·Map scale. The scale is determined by relating the corresponding distance between the map and ground. Scale is what determines the amount of details about the area appear on the a map.
- Methods of projection as means of maintaining the accuracy of the map.
- Nature and amount of the features to be shown on a map. This largely depends on a type of map would be designed under plan and chosen scale size.
PROCEDURE IN MAP MAKING
The construction of a map involves the following important steps:-
(a) the cartographer has to make overall plan of a kind of map to be designed. The plan depends on what is intended to appear on the map about the area. i.e. the plan can be design : topographical map[, statistical map, thematic map or cadastral map.
(b) Collection of data from the area to be mapped. The nature of data to be collected depends on a type of map to be prepared. For instance; if the plan is to prepare a topographical map, the cartographer would have to collect the general geographical details of both natural and artificial features present in the area.
Data can be collected by involving the following methods.
· Making of the field survey in the area.
·By examining the respective vertical aerial photographs.
· By examining the respective satellite images.
· Data can be delivered from the existing sources like books and other maps.
(c) Choice of a scale. This has to take into consideration of both, size of the flat body of a sheet of paper and the size of the ground to be mapped. The scale is determined by relating the corresponding measurements on distance between the map and ground.
(d) Representation of the data or details on the map. The data can be represented by means of the conventional symbols, varied colours, varied shade textures, writing the names of features or places and other important means.
(e) the map should be given with the supportive details to make it well defined. These include; title, key, north directions, scale, date of compilation and others of the same importance.
LIMITATIONS IN MAP MAKING.
(a) Determination of the map scale; by relating the corresponding distances between the map and ground. The uses scale might have been assessed by using wrong measurements between the map and ground. For instance; the surveyed ground distance to be related to map distance might have been subjected to errors accumulation.
(b) Difficulties in cartographic representation. It is much based to the representation of the features on a map. The problem a rise on the following.
· What to be shown on a map regarding that, a map is selective in nature. i.e. It is more difficult to make all details appear on a map.
· Representation of the data of the map by inserting the name of the features, conventional signs and symbols, colors and shades. All these require high skill.
· Dynamism problem. Areas mapped subjected to changes. This makes maps appear outdated. Moreover; it becomes much difficult to update the map.
· It becomes much difficult for all features maintained on a constant scale of the map.
(c) Human problems
(i) technology
The designing of maps requires higher technology. This makes most of the maps designed manually and become not exactly accurate.
(ii) Financial problems
The making of a map is a expensive process. This makes maps not recurrently produced.
(iv)Poor communication
This greatly hinders the process of data collection in areas that would be mapped.
EXERCISE
Q. Write briefs notes on map projection (DSM – Mock 2003)
Q.
(a) Differentiate between thematic and topographical maps.
(b) Outline the problems encountered in a process of map making. MOCK – Qn.)
ESSENTIAL OF MAP
These are the supportive details given on a map to make it well defined with reflection to an actual area on the earth’s surface represented. Such details make the map well understood and interpreted to recognize clearly the geographical facts of the area represented. The are usually given on the map border. Absence of these on the map, makes difficulties in map reading and interpretation.
The main essentials of maps include the following.
(1) Title
It is a heading of a map designed. The significance of it is to tell what the map is for about. This is commonly indicated at the top of the map; and on other maps appear at bottom.
Map title is of two forms depending on what the map shows and include:-
General title
It is given to a map that shows the general geographical details of an area represented. It is established by writing only the name of a region represented. This form of title commonly appears on a topographical map. E.g. MOROGORO.
Specific title,
This is made to appear on a map that shows specific content among of the several about the represented area. Specific title mostly appears on thematic and statistical maps. E.g. MOROGORO LAND TRANSPORT LAYOUT.
(2) Key
It is the list of all conventional symbol, signs and abbreviations together with their meaning on the map border. Maps are conventional in nature as represent land features by means of conventional symbols, signs and initials or abbreviations. It is therefore significantly potential, in order to make a map well defined and understood, it should be established with a key to show what the conventionas symbols, signs and abbreviations or initials stand for.
(3) Scale
A map is much smaller in size compared to the actual area represented which is much larger in size. It is thus, maps are accurately designed up on scales.
It is therefore important for the used to appear on a map in such a way map user may take into consideration of it for futher assessment.
Scale on a map enables the users to understand the relation ship of distance to ground, which then helps to understand the bigness of the area represented and other ground measurements of interest like distance and gradient.
Scale on the map is expressed in three varied ways and these include:-
· In representative fraction. E.g. 1;50,000
· In statement (verbal expression) eg, 1 cm on a map represents 2kms on the ground.
· Graphically; e.g.

(4) Indication of north direction
Any map should be indicate with north direction. On topographical map is commonly indicated by the following conventional sign.

The significance of north direction indication on a map is to enable the map uses to recognize readily the north direction and other important directions of like; North west, East, North east etc, of the represented area. Beside to this; the indicated north helps and features on the map and up on the respective area represented on the earth’s surface.
It has to bear in mind that, bearing of an observation line between two points is measured clockwise from north direction of 0000
(5) Margins
It is the frame work of the map designed. The role of a margin is to show the end of the represented area; and also makes the map impressive and attractive to the users.
(6) Date of compilation.
It is a date of map publication. It is very important for a date of compilation to appear on map. The enables the users to realize the following:-
· Whether the map is updating or outdated relatively to the actual appearance of the respective area represented.
· The changes which have occurred in the area. This can be realized by comparing the latest map to other maps or the given map to the current appearance of the area.
· To calculate magnetic variation of a place by taking into consideration of the rate of changes per annum. Be side to this, it may also help to calculate the new magnetic bearing of an observation line from a place to another place.
(7) Grid lines and latitudes and longitudes.
Grid lines are the vertical and horizontal lines drawn on a map face crossing at right angles giving so perfect squares. The lines are numbered to make eastings and northing.
Latitudes and longitudes are the imaginary angular distance lines drawn on the face of map and given with the degree numbers as have been measured more accurately from the centre of the earth’s surface. These represent the angular distance of the area on the earth’s surface from the centre.
Grid lines, latitudes and longitudes in general, have a potential significance of enabling people using map to locate position of geographical features on the map with reflection to actual areas represented.
Moreover; the latitudes and longitudes enable map mapped areas from the centre of the earth.
Note.
The grid lines are commonly established in more details on large scaled maps as they represent small areas. While, the latitudes and longitudes are widely printed on small scaled maps as they represent wider parts of the earth’s surface.
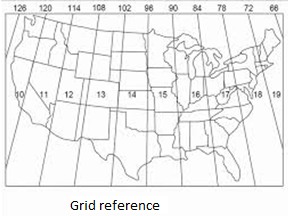
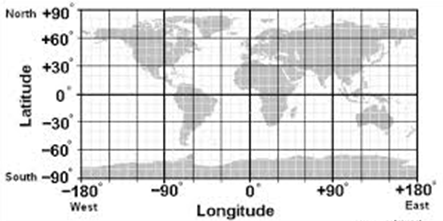
(8) Map identification details.
These included both; serial number and sheet number of the map. The are potentially significant in recognizing easily the maps and also make clear distinction map to maps.
(9) Publisher and copy writer owner.
It is important that, to any map the name of the cartographer or institution constructed the map has to appear. This may help the map users to make necessary consultation with the cartographer or institution constructed the map has to appear. This may help the map users to make necessary consultation with the cartographer or institution to have more clear details about the area which has been mapped.
MAP SCALE
Maps are all generally, much smaller in size as it an be compared to the actual areas represented which are much larger in size. Hence; a map scale is a relationship of map distance to ground represented. This is what understood as map scale. It is thus ; map scale defined as the constant relationship between the shorter lengths on the map and larger ground distances represented.
Or
The ratio of distance between the map and the actual ground represented and the fundamental application for this is as follows:-
|
Map scale = Map distance
Ground distance |
CATEGORIES OF MAP SCALES
Scales of maps are not all the same. They are extremely varied in size, expression methods and units of corresponding distance expression. It is thus; map scale are classified according to such terms of variation.
MAP SCALES ACCORDING TO SIZE.
Large scale :-
It is a type of scale which gives larger representation on a map and permits limited details to appear.
Small scale:-
This makes smaller representation of very wider part of the earth’s surface on a map permit limited details to appear.
Medium scale:-
This provides a medium representation of a part of the earth’s surface on a map and permits details in moderate level to appear.
There is no general agreement of the quantitative limits of the terms, small, large and medium scales. However most of the cartographers agree that:-
- A map with reduction ratio 1;50,000 or less would be large e.g. 1:25,000
- A map with reduction ratio of 1:500,000 or more is considered as small scale e.g. 1:1,000,000.
- A map with reduction ratio of in between of the two above, considered medium scale. E. g. 1:200,000.
Scales according to the forms of expression.
It is widely considered on how a scale has been indicated on the map. This generates three types of scales and include the following.
Statement scale.
This is also known as verbal scale. It is considerably to a scale that is expressed on a map by being stated in words. E.g. 1 cm on a map represents 1 km on the ground.
Representative fraction scale:-
It is considerably to a expressed on a map in ratio or fraction with numerator and denominator appearing in a similar smaller unit e.g. 1:50,000
Linear scale.
This shows the ratio of distance between the map and ground along the line.

Map scales according to expression units used
Scale according to this consideration, broadly categorized into two and include the following.
Metric scale.
It is a scale system in which the units of expression for the corresponding distances between the map and ground are of metric e. e. 1 cm represents 5km.
Imperial scale:-
It is scale system in which the units of the corresponding distances between the map and ground are of imperial. E.g. 1 inbch represents 2.5 miles.
SCALE SIZE OF MAPS
Scale size varies considerably from map to maps as some drawn on large scale, while others may be drawn on medium or small scale. Variation in map scale size is made by some determinant factors.
The main determinant factors for map scale size include:-
- Size of the ground represented by the map
- The size of the map drawn
- Amount of the ground details shown on the map
Size of the ground represented.
Maps which represent varied grounds in size differ in scale size. Smaller ground is made have larger representation on a map and thus; the map is subjected to have large scale. Conversely; wider area is made to have smaller representation and thus; the map subjected to small scale.
Map A; is of large scale as the represented area is smaller in size; while map B is of small scale as much wider area represented.
2. Size of the map.
Maps of varies size differ in scale size. A map of large size makes large representation of an area and thus, subjected to large scale size. Conversely to a map of small size makes smaller representation of an area and thus; subjected to small scale.
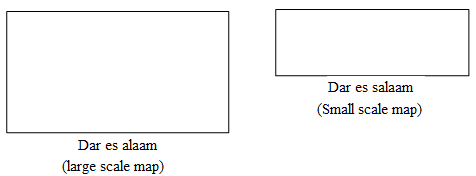
3. Amount of details.
This controls scale size indirectly. Maps constructed to show varied levels of details differ in scale size. A map that planned to show few details is designed to be of small size and thus, subjected to small scale as makes smaller representation. Conversely; a map planes to show numerous details is designed to be of large size and thus subjected to large scale as makes larger representation.
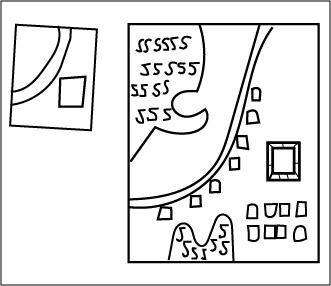
METHODS OF SHOWING SCALE ON MAPS.
On a map, scale can be represented by one or more of the following useful methods.
- Statement scale.
- Representative fraction scale (RF Scale)
- Linear scale
(a)Statement scale.
This shows the relationship of distance between the map and the actual ground represented by being stated in words. E.g. one centimeter on a map represents one kilometer on the ground; 1 cm represents 1 km; or 1 cm to 1km.
Statement scale is also known as verbal scale.
Properties of statement scale.
- The scale on the map is expressed by being stated in words.
- Map distance is given in smaller unit of like centimeter and inch; while, the ground distance given in larger units of meter, feet, kilometers and miles, But it has to be noted that, cm corresponds to meters and kilometers to give metric statement scale, while inch goes corresponds to feet and miles to give imperial statement scale.
· The amount of map distance in the scale is always 1.
(b)Representative fraction scale.
It is a form of scale expression in which the relationship of distance is given in ratio or fraction. It is established with special emphasize of showing the relationship of distance in similar unit. E.g. 1:50,000
![]() Or 1
Or 1
50,000
Properties of RF Scale.
· The scale is expressed in ratio fraction with numerator and denominator.
· The numerator stands stands for map distance; while the denominator stands for ground distance.
· The numerator and denominator treated in similar smaller units.
· The amount of numerator is 1. For instance; scale should not be expressed as 2:50,000; instead it should be 1:25,000.
· It is neutral to metric and imperial scales.
(c)Linear scale.
Linear scale is alternatively known as graph plain bar, divided and open scale. It is a form of scale expression in which the line on the map shows the relation ship of distance between the map and ground represented.
Categories of linear scales.
Linear scales are not all the same. They are extremely varied in appearance and nature of the measurement units used. Thus, linear scales are categorized in basis of the appearance and measurement units used.
According to the form of appearance; linear scales are categorized into two and include:
- Long linear scale.
It is a linear scale system commonly used to obtain direct accurate ground measurements especially of distance from the topographical map. It is very common on large scaled maps.

- Short linear scale.
It is a linear scale system which gives a general idea on the relationship of distance between the map and actual ground represented.

According to the nature of the measurement units used, linear scales categorized into three types. These include the following:-
Metric linear scale.
It is linear scale system which uses metric units to express the relationship of distance between the map and actual ground represented.

Imperial linear scale.
It is linear scale system which uses imperial units to show the relationship of distance between the map and actual ground represented.

Double linear scale.
It is linear scale system with both metric and imperial units. Commonly on top metric or imperial units. Commonly on top metric or imperial measurements may appear, and at below the measurements in imperial or metric units may appear.
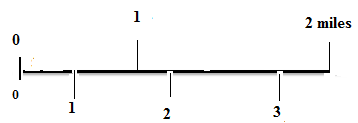
Properties of linear scale
- The relationship of distance between the map and ground expressed a long a line.
- The line scale is divided into equal parts, and each part shows the ground distance in regular interval.
- Most of the linear scales have two major portions of primary and secondary sections.

- The primary section is larger and placed at the right hand side of the line scale . This shows larger ground distances commonly known as primaries, and given in larger units of kilometers along the metric scale, and miles along the imperial linear scale.
- The secondary section is smaller and placed at left of the line scale. This section is divided into fractions to show smaller ground distances known as secondary’s. These given in smaller units of merits along the metric scale, and feet along the imperial linear scale.
Note:-
Along the imperial linear scale, the larger measurements of miles indicated a long the top of the line scale; while the smaller measurements indicated along the bottom of the line scale.
DRAWING OF THE LINEAR SCALE.
The drawing of a linear scale should involves the following fundamental steps.
(i) take into consideration on the relationship of distance between the map and the actual ground represented. Assume the scale is 1 cm represents 0.5 km.
(ii) Determination (consideration) of the unit length for the linear scale drawing. It is principle for the unit length amount should measure ground distance of the whole number.
E.g.
As 1cm = 0.5 km.
X = 1km?
1cm x 1 km = 1cm
0.5 km 0.5
Hence; 2cm measure 1 km along line
(iii) Draw the line to have length that evenly divided by the amount of unit length. The length. The length of the line determined by the space of the map and sometimes by the recommended ground distance to be measured along the line scale.
(iv) Dived the line scale into major portions of priary and secondary sections. Allocate 0 to separate the two sections.
(v) Sub divided the primary section into equal larger segments with respects to the amount of unit length determined.
(vi) Subdivide the secondary section into 10 smaller fractions. The length of each smaller fraction is determined by taking the amount of unit length divided by the number of smaller fractions required.
2cm = 0.2cm
10
Hence; each smaller fraction = 0.2 cm (2mm).
(vii) The segments along the primary section and the smaller fractions along the secondary section should be proved if are accurate. It is by drawing the line of the 200 – 400 from 0 or from the left of the line towards the end of primary section. Similarly, measure the same angle from last point of primary section. Divide the angle lines into similar segments to those of base line and join the points of the three lines.
To the secondary section, draw the line of 900 downwards and upwards at last parts and they should be divided into 10 smaller units.
(viii) Finish by indicating the numbers and the used RF scale or statement scale.
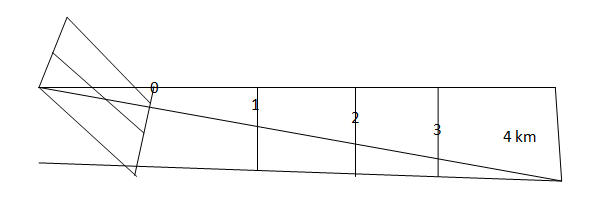
SCALE CONVERSION.
Scale conversion is a cartographic process of changing map scale from one form of expression into another. The cases may include the following:-
· Statement scale into scale
· RF scale into statement scale
· Linear scale into statement scale or RF scale
Statement scale into RF scale:-
Examples:
(i) 1 cm to 0.5 km.
The RF scale from the given statement scale above is determined as follows:-
· Recall 1 km = 100,000 cm
· Then
If 1 km = 100,000
0.5 km = ?
0.5km x 100,000cm = 50,000
1km
Thus,the RF scale = 1:50,000
(ii) 1cm to 0.75km.
The RF scale from the given statement scale above is determined as follows.
Recall 1km = 100,000cm
Then
if 1km = 100,000
0.75km = ?
0.75km x 100,000cm = 75,000
1
Thus,the RF scale is 1:75,000
RF scale into statement scale
Examples
(i) 1:25,000
The statement scale from above RF scale is determined as follows
Recall 1km =100,000cm
Then;
if 1km = 100,000cm
? = 25,000cm
1km x 25,000 = 25,000 = 1
100,000cm 100,000 4
Thus;the scale is stated as 1cm represent 0.25km
(ii)1:250,000
The statement scale from the above RF scale is determined as follows.
Recall 1km =100,000cm
Then;
if 1km = 100,000cm
? = 25,000cm
1km x 250,000cm = 2.5km
100,000cm
Thus; the scale is stated as stated as 1 cm represents 2.5km
Linear scale into statement and RF scale
Linear scale can be converted into statement scale or RF scale or RF scale by considering the unit leghth used to construct it. The unit leght is realized by measuring the length of a segment with a ruler.

According to the given linear scale above; the used unit length is; 2cm measure 3km.
Then;
As 2cms = 3km
1 cm = ?
1cm x 3km = 3km = 1.5 km
2cm 2
Thus; the scale is state as; 1cm represents 1.5km.From the statement scale; The RF scale becomes; 1:150,000
IMPORTANCE OF SCALE.
Scale is useful in two varied way of map reading and interpretation;and making.
In map reading and interpretation.
- Enables the map user to understand the relationship of distance between the map and the actual ground represented.
- It is useful in understanding the relative size of the area mapped by considering the used scale size. For instance; if the used scale size is assessed large, it implies the used scale size is assessed small, larger area represented’
- It is very useful in making area size, distance and gradient determination of the geographical features which appear on a map and on the actual area.
- It is useful to judge the amount of the details of an area represented by taking into consideration of the scale size used. For instance; if the used scale is assessed large, it implies, the map makes larger representation of the small area and it is possible for many details about the area to have been included on the map.
In map making.
- Determines the size of the map to be constructed
- Controls the amount of details to appear on the map relatively to the size used
- It is very useful in the cartographic process of map reduction and enlargement
- Controls the size of the convention symbols, sign and abbreviations
- It is useful in making map projection
- Controls or determines the size of the ground to be mapped
EXERCISE
Q. A racing motorist travels at a speed of 120km/hr covered a ground distance measured on the map by 6cms. If traveled for 15 minutes. Determine the RF and statement scales (NECTA 1984).
Q. A racing cyclist covers a distance of 45 km between town A and b in 30 minutes. If the distance measures 3 cm on the map.
(i) Calculate the speed of the cyclist
(ii) For how long will cover 120km
(iii) Draw a linear scale to read 120 km (NECTA 2002)
Q (a) (i) Define a scale of a map
(ii) How important is a scale of a map to map user?
(b) (i) Given 1:50,000 state the scale into centimeters to a kilometers
(ii) Given – 1cm on a map represents 4 kilometers on the ground. Express this scale as representative fraction (RF Scale) (NECTA 1996)
Q. (i) Why are scale necessary in map making?
(ii) Construct a metric linear scale for 1:30,000 to measure 1.6 km (NECTA 1983)
Q. By comparing a 1;25,000 and 1;50,000 map scales, show the usefulness of scales in map reading and interpretation (NECTA 1995)
Q. (i) convert the scale of the map to a unit lenghth of one kilometer of the linear scale.
(ii) Construct the linear scale by using the RF Scale of 1:30,000 and indicate a distance of 3.6 km (EZEB 2006)
Q. A bus driver traveling along Arusha – Babati road covering a distance of 10 cms on a map in 30 minutes, if the speed of the bus was 50km/hr.
(i) Calculate the distance covered in km
(ii) Find its statements scale
(iii) Draw a liner scale using the above statement scale (NECTA 2000)
Q. Mention two uses of the representative fraction scale (NECTA 1988)
Q (a) Differentiate between large and small map scales
(b) outline the determinant factors for map scale size
(MOCK Q.)
Q. (a) Explain why scales are necessary in map making
(b) By using the unit length of 1 cm to measure 3 km; construct a linear scale to read a distance of 8.2 kilometers.
(MOCK Qn.)
Q. (a) Differentiate between small and large scale maps.
(b) Show the potential significance of scales in cartographic process. (MOCK Q.)
6.2 DETERMINE DIRECTIONS AND AREA
DISTANCE AND SIZE AREA MEASUREMENTS
Topographical maps can be potentially used to asses the measurements of the geographical features observed with reflection to the respective actual areas represented. It is therefore important to learn how the measurements of the geographical features of represented areas can be established from the topographical maps.
The popular ground measurements which can be established from the topographical maps are of distance and size of different land structure.
DISTANCE DETERMINATION
Distance is defined as the length of an elongated object or space between the two points on the earth’s surface expressed in units of linear measurements like; meters, feet, kilometers and miles.
Distance measurements of any elongated object on the topographical map has to take into consideration of the following key issues.
- · Map scale; The ratio of distance between the map and the actual ground represented. This enables the change of convention distance (CD) into actual ground distance.
- · The appearance of the elongated object on the topographical map given whose distance is to be measured. This determines the technique to be applied to get the CD.
Distance determination
For straight elongated objects.
For straight elongated objects,one has to use a ruler more directly to get the conventional distance of the object on the map. i.e. a ruler has to be placed along the elongated object to be measured.

The distance of the road from above is determined as follows:-
· Map scale:- CD of the road = 8 cm
If 1cm represent 0.25 km
8cm represents ?
8cm x 0.25km = 2km
1cm
Thus, the distance of the roads is about 2km.
Distance measurements for the curved elongated objects.
It becomes more difficult to obtain the conventional distance for the curved elongated object with the use of a ruler directly from the topographical map. Up on this challenge and others, one has to resort the use of the following enhancing tools to get the conventional distance of what required to be established. The enhancing tools include the following:-
- A pair of divider
- A piece of paper
- A piece of thread
1. The use of a pair of divider
A pair of divider up on its nature is commonly used to measure short straight courses between points a long the elongated object. To make this, one has to do the following.
- Identify the two recommended points of the elongated object on the topographical map given. The points can be identified by considering the given grid references, place names. Sometimes, both grid references and place names and can be considered.
- Divide the elongated object on the topographical map into convenient short straight sections.
- Open your divider and measure the straight divisions (courses) along the recommended elongated object.
- Add up all the measures to get total convectional distance of the elongated object.
- The obtained convectional distance should be converted into the actual ground distance with respect to map scale provided.
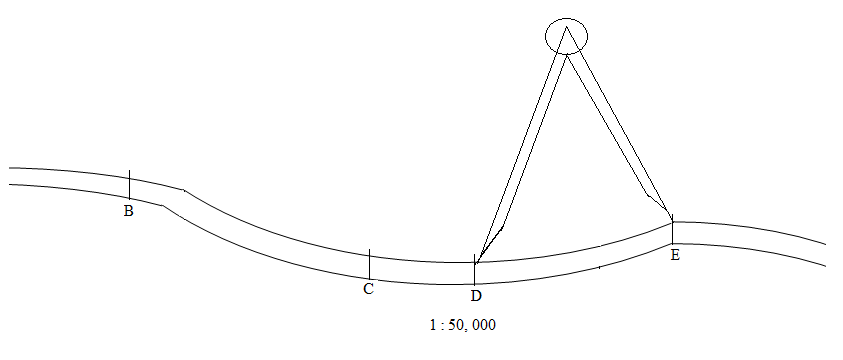
The distance of the road above is obtained as follows:-
AB=1cm; BC = 1.5cm; CD = 0.5; DE = 2cm; EF = 2cm
· The total CD = 7 cm
· Map scale, 1 cm represents 0.5 km
Then;
If 1cm represent 0.5km
7 cm represent ?
7cms x 0.5km = 3.5 km
1 cm
Thus ; distance of the road is of about 3.5 km
2. The use of a piece of paper.
A piece of paper can be used to measure either a short or long distances.
Procedure;
- Take a piece of paper and fold it.
- Put the piece of paper on the map and measure each small distance along the route.
- Take the piece of paper to the linear scale on the map to have ground distance
Example;
The distance of the road below can be determined as follows:-

Distance determination with the use of a piece of paper is up on the following application:-

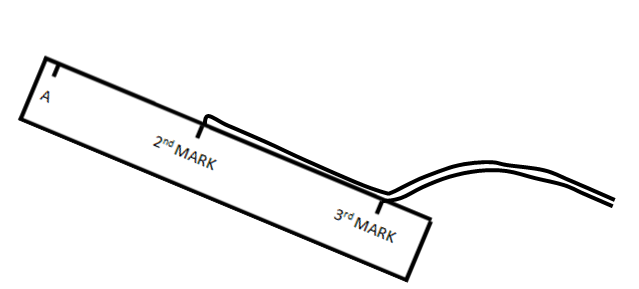
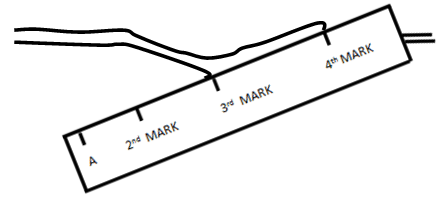


Thus; the distance of the road according to the application above is of about 4.5 km.
3. The use of a thread.
Procedure:-
- Identify the two recommended end points of the elongated object whose distance is to be measured on the map. The two ends can be identified by taking into consideration of grid references, place names or both.
- Take the thread and spread it along the elongated object from one end to another.
- Take the thread to a ruler to measure the conventional distance of the elongated object.
- Convert the conventional distance into ground distance with respect to map scale indicated on the map.
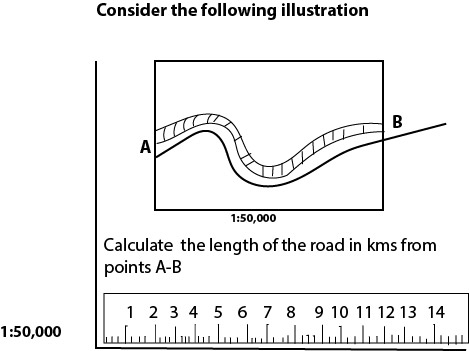
The length of the road from A to B is determined as follows.
- Map scale; 1 cm represents 0.5 km
- CD of the road = 11 cm
THEN;
If 1 cm = 0.5 km
11 cm = ?
11cm x 0.5 km = 5.5 km
I cm
Thus; the distance of the road is of about 5.5km
AREA SIZE DETERMINATION.
Area size refers to a bigness or extent of coverage of any part of the earth’s surface expressed in square unit of measurements. For instance; the bigness of a water body, plantation, forestland, country and others of the same consideration.
Area size determination of any thing from the topographical map should take into consideration of the following two keys issues.
- Map scale; The ratio of distance between the map and the actual ground represented. This enables to change of conventional measurements obtained on the topographical map into actual ground measurements.
- The shape of the feature on the topographical map given whose area size is to be measured whether regular or irregular. This determines the method to be used to get the size.
Area size determination for regular features.
Regular features are those whose appearance well defined. They include; triangle, rectangles, square, circle, trapeze, octogon and others of the same reflection. To calculate the size of these regular figures, some one has to apply a relevant mathematical application with respect to the shape of the features observed on the topographical map.
Consider the following:-
(a) Triangle.
Consider the following illustration.
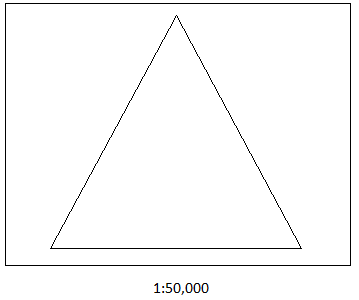
The size of the area occupied by forest is calculated as follows:-
So long the forest land occupied the shape of a triangle, the relevant formula is as follows:-
| Area size = 1/2 x base x height |
*Map scale; 1cm represents 0.5 km
*According to the measurements of the feature on the map.
· Base = 6 cms
· Heigh t = 14 cms
Then;
½ x (6 x 0.5 km) x (14 x 0.5 km)
½ x 3km x 7km
21 = 10.5
2
Thus; the area size of the forestland is of about 10.5 km2
(b) Rectangle;-
Consider the following.
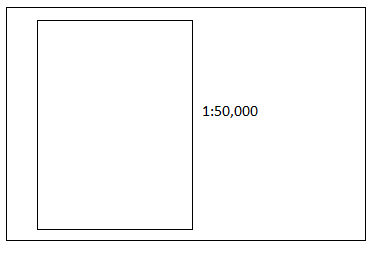
The size of the area occupied by forest from the given topographical map is determined by the following application.
So long, the forestland occupies the regular shape of a rectangle, the relevant formula is given as follows:-
| Area size = width x length |
*Map scale; 1cm represents 0.5 km.
*According to measurements of the figure on the map,
*According to measurements of the figure on the map
- Width = 4 cm
- Length = 8cm
4 cm x 8 cm
(4 x 0.5 km) x (8 x 0.5 km)
2 km x 4 km = 8km2
Thus; the area of the forestland is of about 8km2
NOTE:
The two given above represent the other regular figures. It is therefore important for the students to be knowledgeable to relevant mathematical applications for calculating the size of the other regular figures up on observation on the topographical map.
Area size measurement for the irregular figures.
To determine size for the irregular features observed on the topographical maps, some onbe may resort the use of the following methods.
- Grid square method
- Stripping method
- Geometric method
The grid square method.
It is the most popular and widely used method of determining area for irregular figures observed on the topographical map with reflection to actual areas represented. It is mostly used, if the given map observed to have the vertical and horizontal grid lines on its face forming so perfect square as cross each other at right angles.
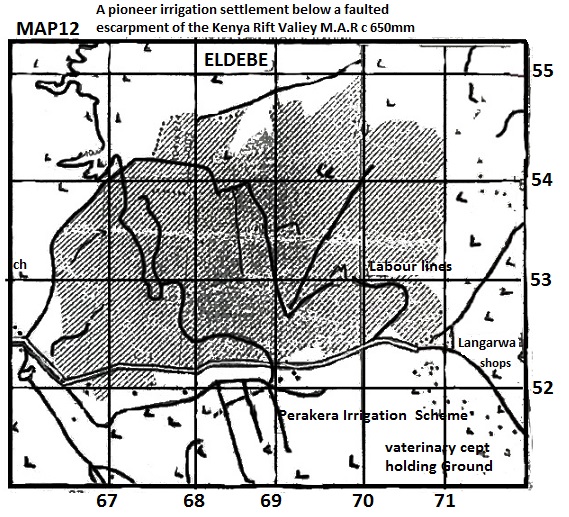
From above, the area size of the coffee plantation is calculated follows:-
* Map scale ……………… 1cm represents 0.5 km
*Method ………………… grid squares consideration
* Actual size of the ground by each grid square determination.
| Area size = width x length |
According to the grid squares on the given map;
- Width = 2cm
- Length = 2cm
2 cm
2 cm
Then;
· 2cm x 2cm
(2 x 0.5 km) x (2 x 0.5km)
1km x 1km = 1 km2
Hence; Grid sguare = 1 km2
Complete squares = 3
3 x 1 km2 = 3 km2
Incomplete squares = 11/2 = 5.5
* 5.5 x 1 km2 = 8.5 km2
Thus; the area size of the recommended feature is of about 8.5 km2.
Stripping method
By this method, part of the topographical map with reflection to the ground represented under consideration is divided into a number of convenient strips. It has to be followed by finding out the area size of each strip and have to be all added to get the entire area size of the feature.
Consider the following illustration:-

The area size of the lake is obtained as follows:-
*Map scale 1cm represents 0.5
- Strip A: 8cm x 1cm
(8 x 0.5 km) x (1 x 0.5 km)
4km x 0.5 km = 2km2
- Strip B: 10 cm x 1 cm
(10 x 0.5 km) x (1 x 0.5km)
(10 x 0.5 km) x 0.5 km = 2.5 km2
5km x 0.5 km = 2.5 km2
- Strip C: 8cm x 1cm
(8×0.5 km) x (1 x 0.5 = 2 km2) = 2 km2
- Strip D: 9cm x 1cm
(9×0.5 km) x 0.5km = 2.25km2
4.5km x 0.5km = 225km2
- Strip E; 8cm x 1cm
(8 x 0.5 km) x (1 x 0.5 km)
4km x 0.5km = 2km2
Then;
2km2 = 2.5km2 + 2km2 + 2km2 + 2.25km2 + 2 km2 = 10.75km2
Thus; the area size is of about 10.75km2
Thus; the area size of about 10.75km2
Geometric method.
It is by dividing the boundary area of the feature into a convenient number of mathematical (geometric) figures of like rectangles, triangles or combination of these figures on\over the same. It should be followed by calculating the area size of the forced geometric figures with respect to the used scale. At last the distinctive size should be added to get the entire area size of the feature.
Consider the following illustration;-
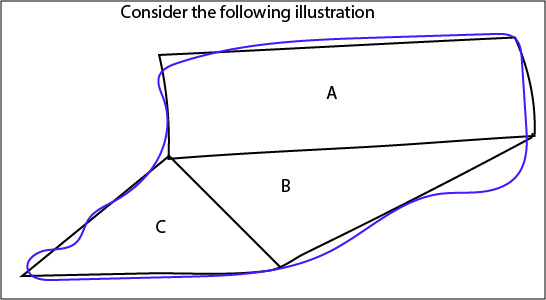
*Map scale …………… 1 cm represents 0.5 km
Rectangle A
| Area size = width x length |
8cm x 18 cm
(8 x 0.5 km) x (18 x 0.5 km)
4 km x 9 km = 36 km2
Triangle B
| Area size = ½ x base x height |
½ x 18cm x 10cm
½ x (18 x 0.5 km) x (10 x 0.5 km)
½ x 9km x 5km
½ x 45 km = 22 .5 km2
Triangle C:-
| Area size = ½ x base x height |
½ x 16cm x 6cm
½ x (16 x 0.5km) x (6X0.5km)
½ x 8km x km
½ x 24km = 12km2
Then; 36km2 + 22.5 km2 + 12km2 = 70.5 km2
Thus; the area size is of about 70.5km2
EXERCISE
Qn. What is the length of the all weather road with loose surface from Grid 930352 to Grid 040339 in kilometers.
(NECTA 1999 —– Extract map Babati……….. Series Y 742)
Qn. Measure the lenghth of the major road from grd reference 886220 to grid reference 975192. Give your answer in kilometers. (NECTA 2004 —– Extract nmap of Mwanza sheer no. 33/2)
Qn. Calculate the area covered by forest in square kilometers.
(Necta 2009 —– extract map of MPWAPWA sheet no 163/4)
Qn. Calculate the area of kisangara estate in square kilometers
(EZEB —– 2009……. Extract map of Kisangara sheet no 73/1)
Qn. Calculate the area covered by plantation agriculture in square kilometers (NECTA 1999 —- Extract map Babati …… Series Y 742).
Qn. Find the actual distance of railway line from grid reference 860975 to 930039 in kilometers.
(NECTA 2006—– Extract map of Mpanda —– sheer no 153/3)
Qn; Calculate the area of Weru sisal estate. (NECTA 1997 – Extract map of Moshi —– series Y 742)
Qn. Measure the distance of the Moshi – mweka road all weather loose surface road (grid 154309 to 135400) (NECTA 1997 – Extract map of Moshi —– series Y 742)
Qn. What is the total area covered by the lake in square km?
Qn. Calculate the area of lake balangida gidaghangaat and give your answer in square kilometers. (NECTA 1998 —–Extra map of hanang — series Y 742)
Qn. Find the total area of the land of this Island found to the west of Easting 180 if the scale of the map to duced y half (DSM – Mock AN 2003—– Extract map Nansio Island sheet 22/1)
Qn. Calculate the area of seasonal swap, south of nothing 080 and west of easting 690. Give your answer is square km.. (JICA —- 2009) – Extract map of utete)
MAP REDUCTION AND ENLARGEMENT.
The cartographic processes of minimizing and expanding the size of any map understood as map reduction and enlargement respectively.
MAP REDUCTION
As it has been pre described, map reduction is a cartographic process of minimizing the size of a map to provide smaller representation of the area.
To reduce the map the following as rules should be followed:-
- All sides of the map i.e. the length and width should be reduced with the same number of times.
- All drawings on the map should be reduced with the same number of times.
- The scale has to be changed to become a comparatively smaller in order for it with respect to map to give the same ground measurement as the old map does.
- The map has to be redrawn by using the reduction measurements.
- Insert the details on the reduced map according to new reduction measurements. The transfer of details should take into consideration of the grid pattens, and if possible for making more accuracy, the diagonal lines can be drawn the grid squares.
Note:
The conventional symbols, signs and abbreviations should be reasonably small in order for them to fit onto the size of reduced map.
Impacts of map reduction.
- The map size becomes smaller and thus gives smaller representation of the area mapped.
- The map would become less detailed as it more selective due to the limitation of the map’s space.
- The cartographic symbols, signs and abbreviation appear smaller.
- The scale of the map becomes comparatively smaller.
Consider the given map and reduce it by ½
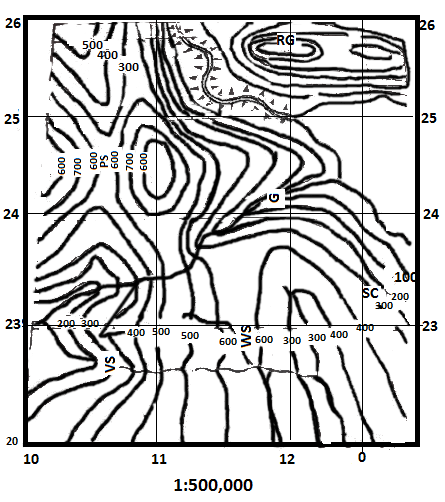
Procedure.
(i) Consideration of the given map by studying it clearly.
(ii) Determination of the amount of reduction reduction factor is by ½
(iii) reduction of the map length
- Length on the old map = 8cm
8 x 0.5 = 4cm
Hence;the new length = 4cm
(iv)reduction of the map width
- width on the old map = 8cm
8 x 0.5 = 4cm
Hence;the new length = 4cm
(v) Reduction of the grid squares
- Grid square on the old map = 2cm
2cm x 0.5 = 1 cm
Hence; the new grid square = 1 cm
(vi) Determination of the new scale
| New scale = reduction factor x old scale |
½ x 1/50,000 = 1/100,000
Hence; the new scale = 1: 100,000
Alternatively the new scale can be determined by the following application
| Map scale = Map distance
Ground distance |
* 3cm = 1 cm to km
3 km
Or
4 cm = 1cm to 1 km
4km
Thus; the reduced map appears as follows:-
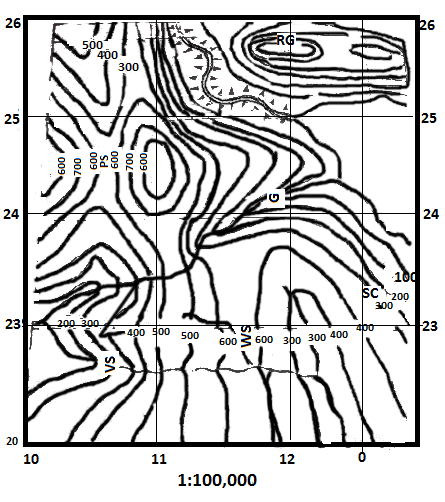
MAP ENLARGEMENT
It is a cartographic process of expanding the size of a map to provide larger representation of the mapped area.
To enlarge a map the following as rules should be followed:-
- All sides of the map, i.e. length and width should be enlarged with the same number of times.
- All drawings on the map should be enlarged with the same number of times.
- The scale has to be changed to become comparatively large in order for it with respect to the map to give the some ground measurements as the old map does.
- The map has to be redrawn by using the enlargement measurements.
- Insert the details. The transfer of details should take into consideration of the grid pattens, and if possible for making mre accuracy, the diagonal lines can be drawn across the grid squares.
Note
The conventional symbols signs and abbreviations or initial should be reasonably large in order for them to fit onto the enlarged map.
Impacts of enlargement.
- The map size become larger and thus, gives larger representation of the mapped area.
- The map is likely to be more detailed as it is less selective due to the larger space of the map.
- The cartographic symbols, signs and abbreviations may appear larger in size.
- The scale becomes comparatively larger.
Consider the given map below and it enlarge by 2.
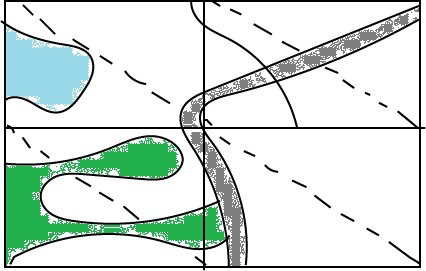
1:50,000
Procedure
(i) Consideration of the given map studying it Clearly.
(ii) determine of the amount of enlargement. Enlargement is by 2.
(iii) Enlargement of the map length.
- Length on the old map = 4cm
4cm x 2 = 8cm
Hence ; the new length = 8cm
(iv)Enlargement of the map width
- width on the old map = 4cm
4cm x 2 = 8cm
Hence;the new width = 8cm
(v) Enlargement of the grid square.
- Grid square on the old map = 2cm
2cm x 2 = 4cm
Hence, the grid square = 4cm
(vi) Determination of the new scale
| New scale = enlargement factor x old scale |
2 x 1/50,000 = 2/50,000 = 1/25,000
Hence; the new scale = 1:25,000
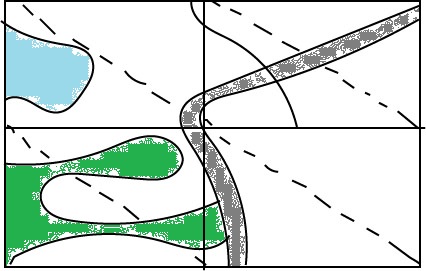
1:25,000
Alternatively the new scale can be determined by the following application.
Map scale = Map distance
Ground distance
8cm = 1cm to 0.25cm
2km
Qn. (a) Outlining your steps redraw provided (1:50,000) to a scale of 1:100,000 and indicate the following features:-
The forest area, Songoro and chimumbu hills, lake Duluti, Nkoaranga hospital and all weather road bound surface.
(b) Examine the two maps and comment on the impact the change of the map scale has on the map area and its contents.
(DSM – MOCK, 2002:Extract map of TENGERU: (sheet No./ 55/4Ed)
Qn. (a) Calculate the approximate area in square kilometers of the contoured map if its scale changed to 1:100,000 (NECTA 2001, Extract map of Kondoa – sheet # 104/4)
Qn. Redraw the map north of northing 120 and west of easting 650 by the scale of 1:25,000 and on it indicate woodland and seasonal swamp.
JICA ===2009) Extract map of ulete)
Qn. Draw a map of district found at the western part of the map by using the scale of 1:100,000 and on its show the following.
(i) Boundary of the district
(ii) Mwanza – Shinyanga road
(iii) usagara – Fela station road
(iv) Railway line
(v) Ngeleka hill, jijawenda hill and kagela hill
(vi) Out crop rock around jijawenda hill.
(vii) Bridges along Fela – Mwanza road (NECTA 2010)
6.3 MAP ORIENTATION
POSITION LOCATION ON TOPOGRAPHICAL MAPS
The position location of geographical features on topographical maps with reflection to actual areas represented can be established by employing one or more of the following methods:-
- Place naming
- The use of latitude and longitudes
- Grid reference
- Bearing and distance
(a) Place naming
By this, method names of places on the topographical maps and up on the earth’s surface can be used to give the position location of a point, feature or another place e.g. the Yanga Sports club head office is at Jangwani.
If place naming method is used for giving position location of any geographical feature on he topographical map and up on the respective actual area represented on the earth’s surf ace, should meets the following conditions:-
- The name of a place to be should be unambiguous i.e. some times more than one places may share the same name.
- The name to be located should be of of significance to a person.
NB: So long the place naming method is facing a problem of ambiguity, it can be dissolved supplementing it with another method of giving location like that of grid reference or direction. E.g. the school is at Ruvu, GR 432675.
(b) The use of latitude and longitude:
It is the most useful geographical method of giving position location on the map and up on the earth’s surface. These measurements are always needed in actual making of the accurate maps. Nearly all maps indicate these along their edge though not all show these in more detail.
Both, latitudes and longitudes are really angular distance measured accurately from the centre of the earth and are expressed in degrees and further divided into smaller measurement units of minutes and seconds.
Latitude is an angular distance measured northward and southward of the line)
Longitudes are the angular distances eastwards and westward of the prime meridian.
The latitudes and longitudes are commonly used to locate the position for the wider features on the small – scaled maps or atlas maps on which these established more detailed.
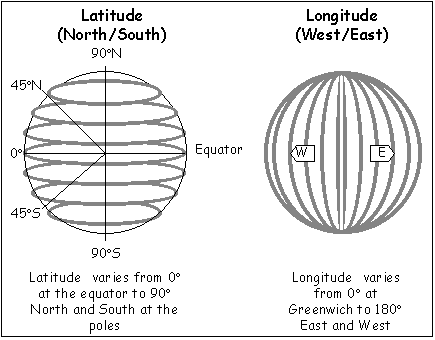
Procedure of giving latitudes and longitudes.
- Firstly establish the degrees of latitudes of a place where is located from one edge to another on the map
- Establish the degrees of longitudes of the place on the map from obne edge to another.
- Combine the degree reading of both latitudes and longitudes to give the proper position location of the place.
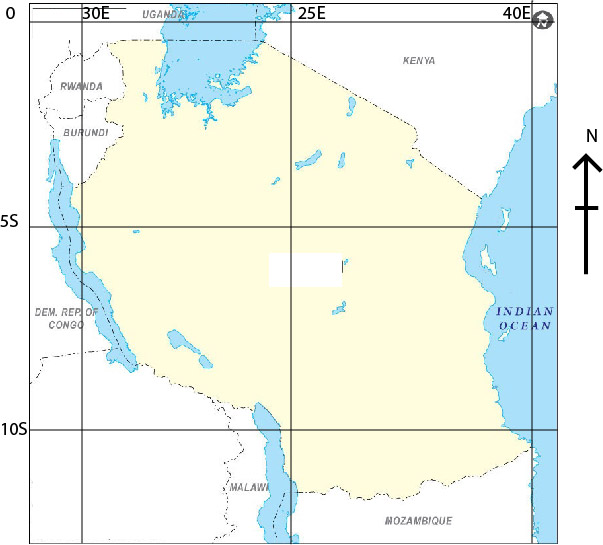
From above Tanzania located in Latitude and longitude position of 10 30’ sand 300 to 400 E.
(c) Grid reference:-
The use of latitudes and longitude becomes increasingly difficult for larger scaled maps. For this and others, map makers have devised a quicker and easier method known as grid reference.
A grid is a network of the evenly spaced vertical and horizontal lines drawn on the map face. The lines drawn perpendicular to one another and cross at right anglesand form the so perfect squares.
All vertical lines are called easting, because of being numbered eastwards, while the horizontal lines are numbered northwards referred to northing.
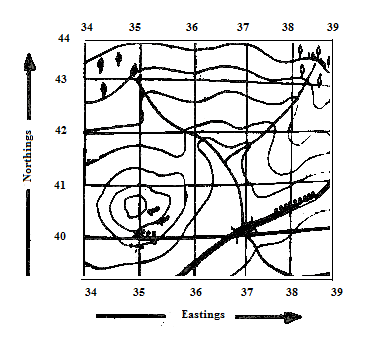
The establishment or reading of the grid reference, it has to start by producing the numbers of easting, and then those of northing.
Grid reference can be given in four figure numbers, if the position to be located is at the exactly intersection of the vertical and horizontal grid lines. It should be in six figure numbers, if the position to be located is not at the intersection of the vertical and horizontal grid lines. However; it is always much better for the grid reference be in six figure numbers regardless of the cases.
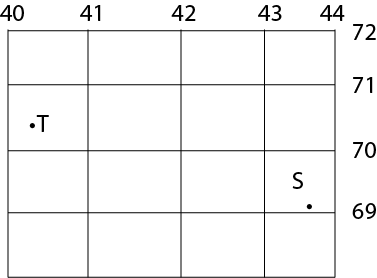
- Point T is located at GR 403705
- Point S is located at GR 437692
Note
The grid lines belong to maps. It is thus, have no reality on the ground. They do not even relate as do latitudes and longitude.
(d)Bearing and distance:
The method is mostly used to establish the location from another position by giving the degree angle measure clockwise from north and the distance of an observation line between the two positions.
Bearing is the degree angle of an observation line connecting two points on the map with reflection to an area on the earth’s surface measured clockwise from north direction.
Distance is the length of a space in between the two position points on the map with reflection to an actual area on the earth’s surface represented.
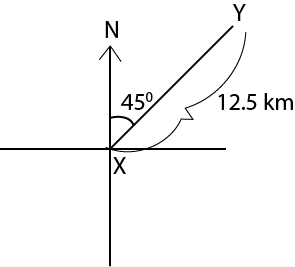
From the above; x is located at bearing and distance of 450 and 12.5 km respectively.
Example:-
Determine the location of point B from point A
Bearing determination
Procedure:
- Identify the two recommended points on the map by considering the grid reference or place names given. Some times both, grid reference and place names can be provided together.
- A straight line has to be drawn to join the two end points on the map. The line represents an observation sight between the two positions in the mapped area on the earth’s surface represented.
- Establish the four cardinal points at the position of observer. The establishment of the cardinal points should take into consideration of the north direction indicated on the map. On some of the topographical maps, the north direction is given by means of a true north.
- Take the protector and measure the angle of an observation line that connects two position points clockwise from north direction.
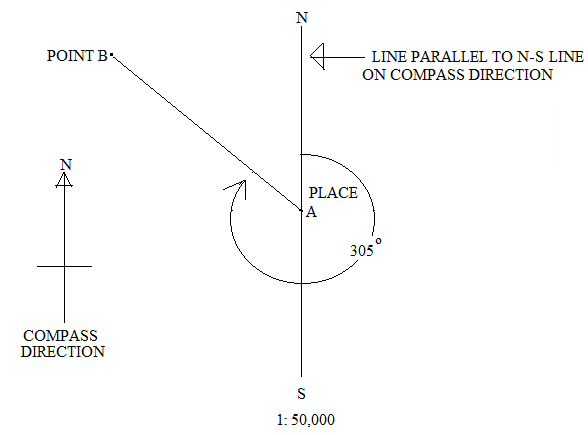
The bearing of point B from point A is of about 3050
Distance determination
Procedure
- Take into consideration of the map scale
- Measure the conventional distance (CD) of the observation line that connects the two points on the map.
- Convert the CD into AD with respect to map scale
- From above the CD = 10cm
Scale; 1cm represents 0.5 km
Then;
10 x 0.5 km = 5km
Thus; point B is located at bearing and distance of about 3050 and 5km respectively from point A.
Calculate the Bearing
Backwards bearing :–
It is the reverse of the bearing of an object taken in front of the observer’s position along the observation line is called forward bearing. While the bearing of an object measured clock- wise from north direction backwards to the former observer’s position along the same sight line is called backward bearing. It is thus, backwards bearing s defined as the degree angle of the object measured backwards to the former observers position.
Backward bearing of an object is obtained by measuring the degree angle of an observation line clockwise from north direction backwards to former observer’s position. This can be illustrated as follows:-
- Mark the four cardinal point at the observed object whose backward bearing to be established.
- Take a protector and measure the degree angle of an observation line clockwise from north direction
Example
The backwards bearing of point b from point A can be established as follows:-
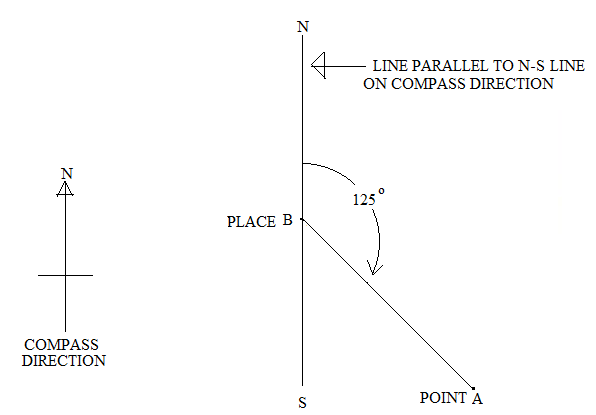
Thus; the backward bearing of point b from point A is of about 1250
Note
If the forward bearing of the object has been established, the backwards bearing can be determined by mathematical procedure.
| BB = FB + 1800 |
BB = FB + 1800 if the FB IS LESS THAN 1800
BB = FB – 1800 if the FB IS GREATER THAN 1800
From the above case
The FB = 3050
3050 (FB) > 1800
THUS ; The BB = 1250
Significance of the backward bearing
Backwards bearing is determined purposely to check the accuracy (correctness) of the forward bearing which has been taken in front of the observer’s position to an object along the sight line. It is checked by observation the difference in degrees between the BB and FB.
Always the standard difference should be 1800 if the difference is less or greater than 1800 the reading has been subjected to an error and thus needs correction to make proper determination.
Correction of errors
Correction of errors is attempted with the use of the mean error but considering the varied cases.
Mean error is computed by making the following application:-
| Mean error = Amount of error in degree
2 |
| Amount of error = The different between BB & FB – 1800 |
The correction of errors with the use of mean error is done by making the following applications:-
When BB > FB
| FB + Mean error BB – Mean error |
When BB < FB
| FB – Mean error & bb + Mean error |
DIRECTIONS
Direction means the course or a line along which a person or thing moves or locks or which must be taken to reach a destination.
Direction on the map can e given in four, eight or sixteen cardinal points of compass and their corresponding angular bearings.
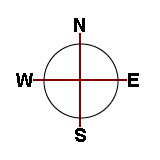
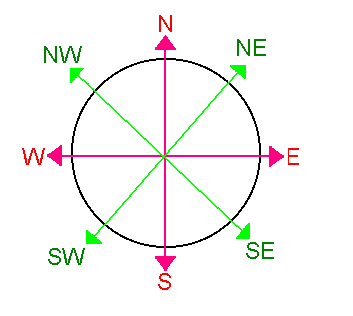
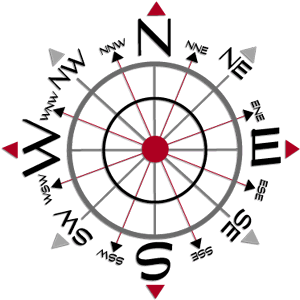
Note:-
One land direction measured with the use of magnetic compass. The magnetic compass has a needle which always points to the north.
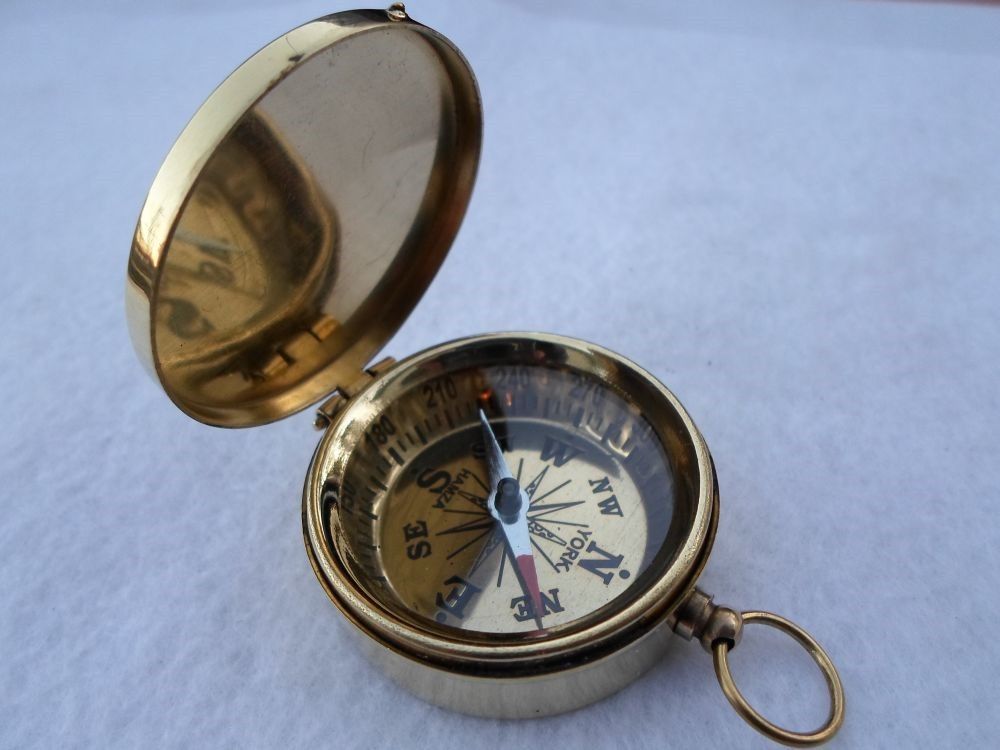
ALIGNMENT OF ELONGATED OBJECT.
Alignment is defined as a general direction and bearing of an elongated object on the map and up on the earth’s surface measured from the central position along the straight line. Elongated object can be of like that of a road, railway, ridge, coastline, river and others of the same nature.
Alignment is best described by stating both, direction and bearing E.g. the road aligns from 450 to 2250 (SW)
Steps involved in giving the alignment
- Identification of two end points on the topographical map given. The end points can be identified by taking into consideration of the grid reference or place names given.
- Drawing of the straight fine line using a ruler and pencil to join the two points.
- At the central point of the drawn line mark the four cardinal points.
- Take a protector and measure both degree angles in which the drawn straight line trends.
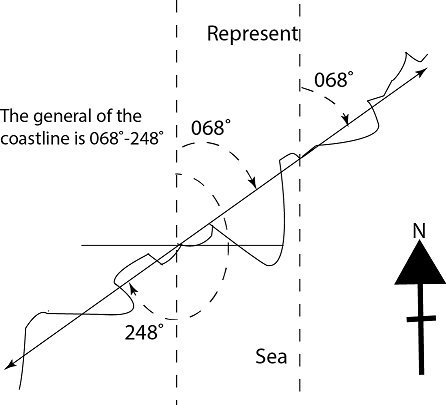
The alignment the coastline is from 0680 (ENE) to 2480 (WSW)
EXERCISE
Qn. Calculate the forward and backward bearing of Ryamugasire island grid 930340 from buhare home economics training centre grid 868324 (NECTA 2005 – Map extract of musoma sheet 12/2)
Qn. Calculate the forward and backward of Songea town at Grid reference 829169 (NECTA 2003 – Map extract of SONGEA sheet 299/1)
Qn. The compass bearing takes from a fishing boat to Samgoro hill and pump house Gr 045647 were 1450 and 1220 respectively.
Qn. By using grid reference write the position of the fishing boat.
Qn. Find the true bearing of the Samgoro from pump house (NECTA – 2002 the map of part of KENYA – NYAKWERE)
Qn. The compasses bearing of Lugongo and Kiamera hills were 1300 and 1490 respectively. These bearings were taken from a steamer on the lake.
Qn. Give the grid reference of the position of the steamer
(ii) Measure the distance in kilometers from the position of the steamer to Kaswanga pt :
(NECTA 1994-The map extract of Rusinga island)
Qn.An amateur surveyor recorded 87º as forward bearing from Goi Hill to Sangasanga hill, and 263 as his backward bearing.
(i) Correct the discrepancy of these readings.
(ii) State the importance backwards bearing.
(NECTA-2001, the map extract of KONDOA (sheet104/4.
Qn. Give the bearing of:
(i) The Masonic Lodge from Kibwesi
(ii) Tanzania packers factory from kiutu peak .
In each case, give the backward bearing.State the rule that enable you to check the correctness of your bearing (NECTA 1992 Extract, map of Arusha)
Qn. Determine the trend alignment of part from Raska zone grid reference 137417 to grid reference 148360 (NECTA – 2008 extract map of TANGA sheet 130/1)
Qn. Locate the position of Njoro school (NECTA 1997 – Extract map of Moshi Series y. 742)
Qn. (a) Find the trend of the major road from mwanza city to Musoma.
(b) Show the alignment of the railway line (NECTA 2004 – Extract map of Mwanza sheet # 33/2)
KINDS OF NORTH INDICATED ON TOPOGRAPHICAL MAP.
On most of the topographical maps, varied north are shown and these include rthe following:-
- Magnetic north (MN)
- True north (TN)
- Grid north (GN)
Magnetic north
Magnetic north is the one given by the line of half arrow head on the map representing the direction of magnetic pole (earth’s magnetic field) from the mapped area.
Magnetic pole is position of natural attraction of global magnetism
The direction of magnetic pole is detected by a needle of magnetic compass in the mapped area by the time of map construction. The needle of the magnetic compass points towards the direction where the global natural point of magnetism is located from the area to be mapped.
The north line on most of the African maps is not uprightly vertical . It is slightly vertical towards west as the global natural point of magnetism is located in America.
The natural point of global magnetism is found off the coast of Boothia peninsular, the north of Canada nearly price of Wales and In South is in Victoria land Antarctica.
However; the direction of magnetic pole shown on the map by magnetic north, is irregular as the natural attraction of magnetism is in water and the rate of change per year is noted.
True north
True north is the one given on the map as a star head line to represent the direction of global North pole (900 latitude) from the mapped area. It is parallel with the lines of longitudes.
The north pole is where all lines of longitudes meets. True north is the most useful north to geographic and it is mostly referred in the determination in position direction on the topographical map and up on the actual area represented.
The direction represented by true north does not change over the time because, the North pole is steadly constant in position.
Grid north
It is the unpointed north line given on the map, which follows the system of easting gridlines. This does not represent or show anything on the earth’s surface and that is why given by the un pointed line.
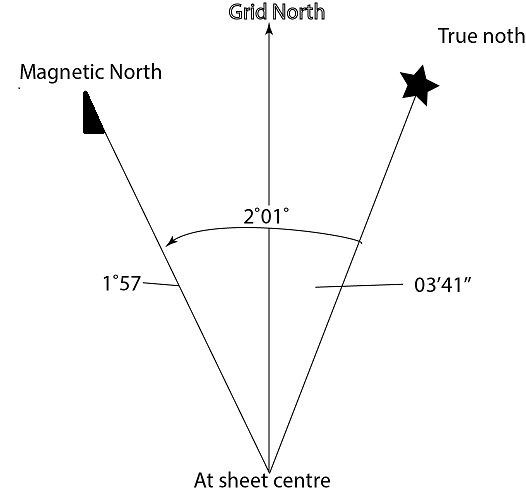
Magnetic variation:-
Magnetic variation is an angular distance in a place from the direction magnetic pole to the direction of north pole. i.e. the measured angular distance from true north to magnetic north on the map with reflection to the actual area represented.
Always the direction of magnetic pole as represented by magnetic north on the map changes, but does not coincide with the direction of north pole (true north) This makes a considerable angular distance in between of the two direction does not remain the same at the time due to the irregulaties of the magnetic field on the earth’s surface and thus, give to magnetic variation.
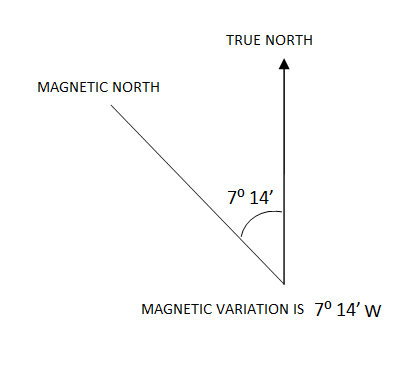
Magnetic variation is 70 14 W
Magnetic bearing:-
It is a degree angle of an observation line of a place to another place measured clockwise from the direction of magnetic pole. This is not rigid as the direction of magnetic pole is irregular.
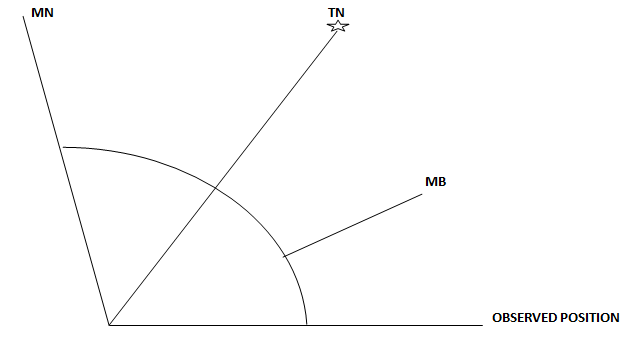
True bearing:-
It is a degree angle of an observation line of a place to another place measured clockwise from the direction of north pole. The angle on the map is measured clockwise from north pole towards the line of the observation. This is rigid as the direction of North pole from any place is steadily constant.
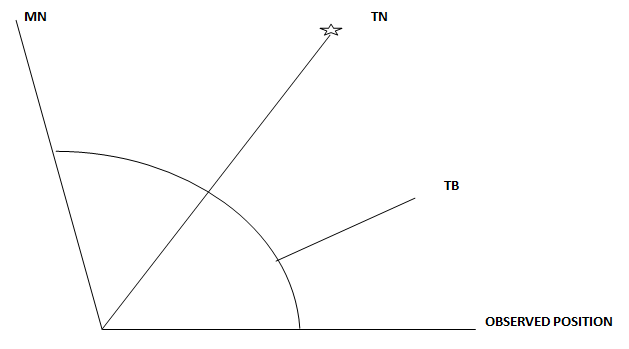
Magnetic variation projection:-
For some wishing to determine (project) magnetic variation of a place on the earth’s surface with reference to the previous one,has to make the following fundamental steps.
(1) Data analysis as per the details (content) available.With respect to this, the following should be recognized.
- The previous recorded magnetic variation.
- The date when the last magnetic variation has been recorded.
- The current date whose magnetic variation to be projected.
- The rate of change per certain given defined period of time like, year, month etc
2. Determination of the time interval by subtracting the old date from the new date.
i.e.
| Time interval = T2 – T1 |
3. Determination of the total change of magnetic variation by multiplying the rate of change with the determined time interval.
4. Get the new magnetic variation of the place by making addition or subtraction to the past magnetic variation. Addition is made if there is positive change: while, subtraction is made if there is negative change.
Exercise
Qn. Town Z had magnetic variation of 320 42 by march 1980, what was the new magnetic variation of the place by December 1990, if the rate of change is 10’ per annum positively.
Qn. Town X in west Africa had MB and TB of 450 23’12’’ and 250 34’57” respectively by January 1990. If the rate of change of the direction was 15’ per annum negatively, calculate the following by July 2005.
(i)Magnetic variation
(ii) True bearing
(iii) Magnetic bearing
Qn. (a) Differentiate between magnetic bearing and True bearing.
(b) Town X had magnetic variation of about 340 21”by November 1982. What was the new magnetic variation of the same town by February 1993, if rate of decrease stood at 15’
annually.
Qn. Differentiate between the magnetic north, True north and grid north (NECTA 1995)
Qn. (i) Define true bearing and magnetic bearing.
(ii) January 1945 the magnetic variation over town X.
Grid bearing
It is a degree angle of an observation line of a place to another place measured clockwise from the grid north.
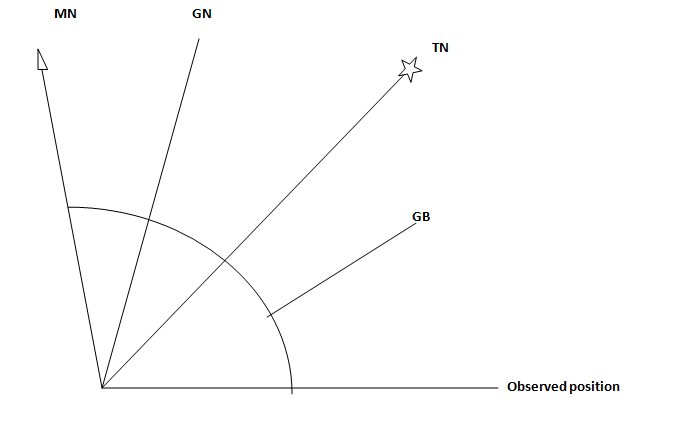
The conversation of magnetic bearing into true bearing
To convert magnetic bearing into true bearing, some one has to take into consideration of the direction of magnetic pole relatively to the direction of north pole.
- If the direction of magnetic ole is to west of north pole direction on the map and up on the earth’s surface, true bearing of the place is obtained by applying the following formula.
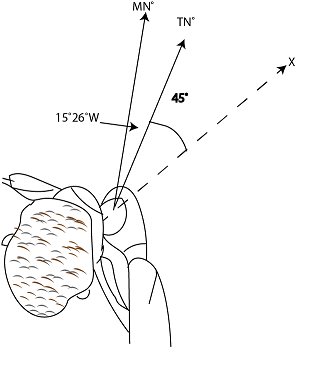
| TB=MB – MV |
450 – 150 26 = 290 34′
Hence: the TB is of about 29º 34’
While:
MB = TB + MV & MV= MB – TB
- If the direction of magnetic pole to east of the north pole direction on the map and up on the area represented, the true bearing is obtained by applying the following application.
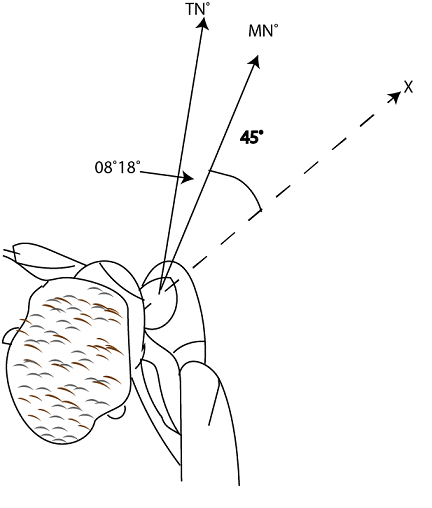
450 + 080 18’=53º18′
Hence,The TB is of about 53018′
While:
MB = TB – MV & MV = TB – MB
EXERCISE
Qn. 9’56 If the annual decrease rate stood at 5’Find the magnetic variation of the same town in October 1966 (NECTA 1989)
Qn. (a) Define true bearing and magnetic bearing
(b) The true bearing and magnetic bearing aver town by January 1990 were 530 42 and 58’21” respectively, What can be the projected magnetic variation over the same time by july 2010 if the rate of change wood at 15’E
Qn. (MOCK)
(a) (i) Define true north, grid north and magnetic north
(ii) Town Y had MB and TB of about 27036’ and 540 of 23” respectively by September 1982. Determine the MV. MB and TB of the same town as it was February 1993 if the rate of change stood 18’w.
6.4 UNDERSTANDING FEATURES ON MAPS
RELIEF REPRESENTATION ON MAPS
Relief refers to the physical appearance of an area by contrasting landforms. Or Variation in shapes and forms of an area over the earth’s surface.
The land forms which make the physical appearance of an area called relief features. These being landforms have defined shape and heights above the sea level.
The cartographers use to show the relief features on the maps by employning certain methods which reflect their shape and heights in response to the physical appearance of the area.
The main methods employed for this purpose include the following:-
1. Contouring method.
The method involves the drawing of contours (isohypes) on the map face. Contour is an imaginary line drawn on the map face connecting all points of exactly equal height above the mean sea level. The first contour map was introduced in 1791.
Contours as used for relief representation on large scaled maps (topographical maps) reflect shape, size and height of landforms of areas represented.
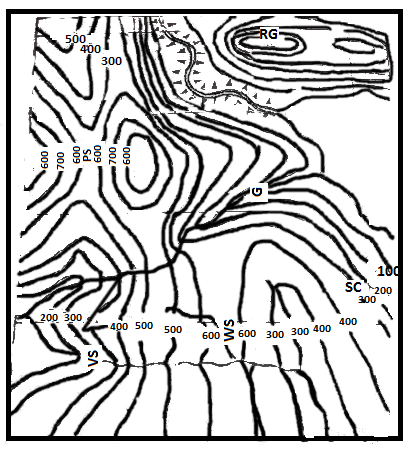
Properties of contours as used for relief representation.
(a) Contours on the maps are numbered either in Meter or feet. The numbers represent the attitude values of relief features in the region mapped.
There are two numbering the contours
• The contour numbers are written on the higher Side of the contour line.
• The contour numbers are placed in the contour lines
(b) Contours are drawn in a specific interval on the map.
(c)Contours of different elevations do not cross each Other.
(d)When Contours lie closely to one another indicate steep slope, and if observed to lie far apart indicate a gentle slope. Based to this, contours of different heights may join to form a single contour line where contours are not observed over wider part, implies the landscape is widely flat.
(e)Usually contour lines tend to join around where there is the presence of a rounded landform like; a hill, plateau, escarpment and others.
(f)Contours form V shape pointing up or down stream to indicate the presence of a river valley or spur respectively.
Merits of contours
• Contours are the most popular and widely used method for showing relief on topographical maps.
• Contours on a topographical map can be association with other methods of showing accurate heights of the relief features of an area represented. Provide the basis for hypsometric map construction.
• Contours on a topographical map can be associated with other methods of showing relief like; spot heights, trigonometrical point and benchmarks.
• Contours on a topographical map do not hide other details.
• Contours aid in making of some ground measurements from the topographical map.e.g/gradient determination
• Provide the basis for cross section drawing from the map. Setbacks of Contours
• Some times, contours fail to show certain highest heights due to the limitation of the vertical interval used. Such heights can be shown by means of spot or trigonometric point.
• Some of the landforms are not capable for being represented by means of contours e.g. coral reefs, levees and other of the same refletion .
• Contour are not suitable for showing relief on a small scaled map.
• It needs high skill to make interpretation on the relief features by reading the contours.
• It needs high skill to produce contours on map spot heights and form lines should be initially established ahead to contours.
• It becomes difficult to determine the exact altitudes of such parts which are not crossed by the contours.
The altitude of such parts given in estimation basis.
Setbacks of contours
Some times contours fail to show certain highest heights due to the limitation of the vertical interval used.such heights can be shown by means of sport height or trigonometric point.
2. Form lines
A surveyor has some times to draw contours by eyes by estimating where the contours would run between two sport heights or by sketching them in approximately (interpolating). The lines drawn in this way are called forms line. Hence forms lines are defined as the dotted and unnumbered lines drawn on the map face joining points of approximately the same heights.
Form lines are not always plotted at fixed interval and these provide the basis for establishment of contours or layer units on the map.
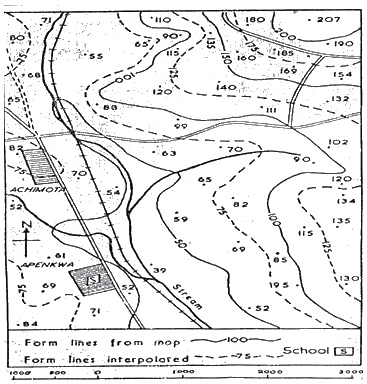
3. Layer tinting.
(Layer colouring)
It is one among the most useful methods for showing relief on maps. It is by indicating distinctive colours on the map face, to contrast zones (Bands) of altitudes. The method is mostly used for Relief representation on small scale maps (atlas maps).i.e. on maps that represent very wider parts of the earth’s surface.
A map that involves the system of colours to indicate relief is called hypsometric map. The method was firstly introduced in 1878.
Any layer –tinted map should carry a key to interpret the different colour for varied bands of altitude. The common colours used for this purpose include the following:-
- Blue; represents water body. Light blue means Shallow water and dark blue means deep
- Green, indicates low land of either coastal plain or river valley. Pure green colourrepresents much low land with altitude from 0-200m; while; light green represent lowland of high altitude from 200-500m).
- Yellow, indicates high land. Whitish yellow represents high lands of low altitude from 500-1000m); while pure yellow is for higher land with height from 1,000-2000m).
- Brown; indicates highest mountain or area with permanent ice.(2000-4000m).
- Red or pink, indicates very high elevation with height above 4000m

Merits of the layer tinting method.
- It makes a map look impressive and attractive to the users.
- It is useful method for showing relief on a small scale map.i.e on maps which represent wider areas.
- It is associated with the method of trigometric point. The trigonometric points provide specific exact highest altitude of particular part.
- They give quick information to map user so long the colours easily seen on the map.
Demerits of layer tinting method.
- It shows general altitude i.e. does not give the exact height of specific or particular point.
- It is more expensive to produce the layer colored map
- The method does not reflect the shape of relief features of an area on the map.
- Always colours carry certain people’s mind. It is therefore, someone may have wrong interpretation. e.g the presence of green colour on the map may makes some one to reflect the presence of thick ever green forest.
- If colours have already been used for layer tinting on the map ,can be used for other purposes on the same map.
- It is not a complete method by itself. It relies on the presence of contours or form lines to provide the basis for colouring.
4. Hachuring
The method involves the use of hachure.
Huchure is a series of small lines drawn on a map face showing the direction and steepness of slope. The lines are drawn to follow the slope of the ground or direction of the slope on which water would run. It is old method of showing relief on maps and it was devised by L.C Muller in 1788. It was later improved by Austrian topographer Johann George Lehman in 1799.
Merits of hachuring
- Hachure easily seen on the map and thus give quick information about the features represented.
- Provide pictorial view of the relief features on a map.i.e they can successively communicate quit specific shapes of terrain.
- Show clearly the direction of slopes on the map. i.e. They provide a general sense of steepness.
Demerits of hachuring.
- Hide other details seen on the map and thus give quick information about the features represented.
- Hachure on the map is non numeric.i.e.are not associated with height numbers of relief features represented. Thus, the map users are not in position to detect the relief heights by studying hachure.
- Greet skill is needed to produce hachure on a map.
- The hachure may not be maintained on constant scale.
- The method is dying out. It is not much used for relief representation on the modern constructed maps.
5. Hill shading.
It is a method of showing relief in which some parts of the map are shaded to indicate the presence of hill, as they would appear if a light were shining on them. Usually, the slopes which face light are shaded lightly while those facing away are in shadow.
Merits of hill shading
- It gives pictorial view to the map user about the hills of an area shown on the map .it thus becomes easier to understand.
- Make a map looks impressive and attractive to the users
Demerits of Hill shading.
- Does not give heights of hill shown on the map.
- The shades indicated on the map might hide other details.
- It becomes difficult to determine the gradient of the hills represented so long, the hill shades not given with height numbers.
- May not easily maintain on constant scale of the map.
6. The use of physiographic diagrams.
The method involves the drawing of diagrams on a map face reflecting the physical slope of the relief features like hills and mountains as they have been observed in the area. This conventional representation of land forms on the map, gives an impression of viewing the landforms in three dimensions.
The physiographic diagrams are also known as pictorials.
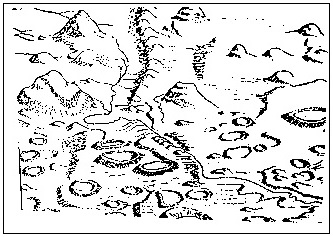
Merits of the physiographic diagrams
- The physiographic diagrams if appear on the map, become impressive and attractive to the map users.
- The diagrams provide more pictorial view of the relief features representated as they more reflect the shape of the land forms represented. It is thus, becomes so much easier to understand.
- They are easily seen on the map and thus easy to read and provide quick information to the map users.
Demerits of Physiographic diagram
- Hide other details.i.e may not make other details for the represented area to appear on the map.
- Physiographic diagrams are non numeric as do not provide the heights of landforms represented thus, they do not make the map users to understand the altitudes of the represented relief features.
- Only limited landforms can be shown. i.e. not all landforms can be shown by this particular method.
- Not good method for the accurate maps as the physiographic diagrams cannot be maintained on the constant scale of the map.
- The method is no longer used for relief representation on the modern constructed maps.
7. Trigonometric point.
It is a very small triangle conventional sign with a dot at its centre and value number beside to it. This is non imaginary method for relief representation on the map as trigonometric points established up on the presence of height ground station. (Trigonometric station) on the ground. It is thus, trigonometric point is indicated on the map provided the represented area has trigonometric station.
The number given with the trigonometric point represents the highest altitude of the land scape
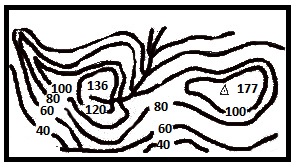
Merits of the trigonometric point.
- It is easy to indicate trigonometric point on the map by the cartographer
- It is non imaginary method for relief representation on the map.
- Enables the map users to recognize the highest relief height very easily.
- It shows the accurate relief height as it was measured more accurately in are above the sea level or from a recognized reference point of bench mark.
- Sometimes. it assists the contouring method in showing certain relief heights due to the limitation of the contours interval used.
Demerits of the trigonometric point.
- Not easily seen on the topographical map. It is as the topographical map shown the general geographical details of an area represented.
- Trigonometric point on a map does not give the shape of the relief feature represented.
- They are selective for showing only the highest heights of the relief features represented.
8. Spot height
It is a conventional dot (point) together with the height number on a map face. It serves imaginary method for showing relief heights as have been measured above the mean sea level. The number shows the height of a relief feature shown on the map
Merits of the Spot height.
- It is easy to indicate spot height on the map by the cartographer.
- Enables the map users to recognize the relief height very easily.
- It shows the accurate relief height as it was measured more accurately in the area above the sea level or from recognized reference point of a bench mark.
- Sometimes; it assists the contouring method in showing certain heights due to the limitation of the contours interval.
- It shows the heights of hill summits as well as points along the interested structures
Demerits of spot height.
- Not easily seen on the topographical map. It is so as the topographical map shows the general geographical details of an area represented.
- Spot height on a map does not give the shape of the relief feature represented.
- It is imaginary method for showing relief on a map.
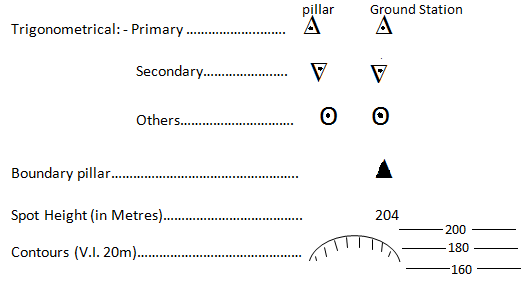
9. Bench mark
It is a surveyor mark unit indicated on a wall, pillar, or building used as reference point in measuring altitudes.
Or
a point of reference used by a surveyor in measuring altitudes.
Bench marks indicated on maps following the presence of such marks in the are mapped.
Bench marks on maps appear by the conventional letter of BM together with height numbers measured on the ground.
Categories of Bench marks.
Bench marks indicated on the map and up on the landscape represented are extremely varied. Some have been established to provide permanent reference in measuring altitudes, while others provide short terms reference to measure altitudes by doing surveying. With respect to this, bench marks are categorized into two and include the following:-
Temporary bench mark
These established so closely to the site of surveyor to have continuous reference in surveying process. They use to appear by conventional letters of TBM. However; these on topographical maps do not commonly appear.
Ordinance bench marks.
These are the fixed bench marks indicated on the map with reflection to the actual area represented. They provide permanent reference in measuring altitudes of other interested point or areas.
Merits of the bench mark.
It is easy to indicate it on the map by the cartographer.
It is non imaginary method for relief representation on the map.
It shows the accurate relief height as it was measured more accurate on the landscape above the sea level.
Demerits of the bench mark.
Not easily seen on the topographical map. It is as the topographical map shows the general geographical details of an area represented.
Bench mark on a map does not give the shape of the relief feature represented.
Asses yourself!
Are you able to describe the different methods of showing relief on maps?
Do you understand the application of the different methods as used for relief representation?
Are able to narrate the merits and demerits of the methods as used to show relief on the map?
EXERCISE
Q. (i) why contours are considered to be the most useful ways of showing relief? (NETA 2007).
(ii) Explain the demerits of using hartures to represent relief on the map (NECTA – 2007).
Q. Outline and describe the different methods employed by the map maker to show the exact height of relief features on the map (NECTA 1997).
Q. (i) Describe the methods used to portray the relief features on the map.
(ii) Which other methods may have been used to depict the relief features on the map? (NECTA 2003, The map extract of Songea sheet 299/1).
Q. Describe any two demerits of hill shading as a method of representing relief on the map. (NECTA 2002).
CARTOGRAPHIC SYMBOL AND SIGN
Topographical maps are drawn for geographical studies do not show the natural and artificial features as they appear in real life on the earth’s surface. Some of the selected conventional signs and symbols used to serve this purpose, and these are collectively referred to cartographic symbols and signs.
Hence the cartographic symbols and signs are defined as the conventional signs and symbols inserted on a face of a topographical map representing the natural and artificial features of an area mapped.
They act as language of map to provide geographical details of areas represented.
The cartographic symbols and signs are used to represent the natural and cultural features on the topographical maps, should have the following qualities.
• Should be correctly and clearly shown on the map.
• They should be easy to read.
• Easy to understand and interpret
Note.
Symbols are those used in maps which look like the natural and artificial features represented, while the signs are those which do not look like the natural and artificial features represented.
CLASSIFICATION OF THE CARTOGRAPHIC SYMBOLS AND SIGNS
Cartographic symbols and signs are extremely varied and thus, classified into different types. They are classified according to their form of appearance on the map, and nature of data shown on the map.
According to the form of appearance, cartographic symbols and signs classified into the following types:-
Point cartographic sign:-
These are the cartographic signs in form of dots inserted on the map face. They are employed to show positional data on the mp. i.e. show a specific point on the map and up on the earth’s surface there a certain object or place occurs.
Line cartographic symbols:-
These are the conventional symbols, which take linear distinctive form of appearance on the map. They are employed to represent the elongated objects on the map with reflection to an area represented. Examples of the elongated objects represented by the line cartographic symbols are of; power transmission lines, roads, railway and administrative boundaries.
Areal cartographic sign:-
It is the conventional representation established on the map by which a continuous distinctive shade or tone employed to show a feature that covers wider part. Such features include; swaps, plantation, lakes and others.
Pictorial (descriptive) cartographic symbols:-
The conventional symbols given on the map to portray the shape of the features represented. e.g. the symbols for church, mosque, bridge and others of the same reflection.
Geometric cartographic signs:-
The conventional signs in form of geometric figures of like square, triangle, circle and other e.g. the trigonometrically point.
Letter or number cartographic signs:-
The conventional representing on a map in which one or more letter or numbers given. E.g. such for school, ch-for church, pwd – for public work department and others.
According to the nature of the features represented, cartographic symbols categorized as follow:-
Relief cartographic symbols:-
These are the symbols inserted on the map, representing the relief of an area. They include; contours, hachure, spot heights, trigonometric point and others.
(b) Transportation cartographic symbols:-
The conventional signs representing transportation systems of areas represented of like; roads, railways, air fields etc.
(c) Vegetation cerographical symbols:-
The symbols for natural and planted vegetation.
(d) Settlements cartographic symbols:-
The symbols, which represent both rural and urban settlements of an area on the map. They include round black dots for rural settlements and black rectangle blocks for urban settlements.
(e) Water bodies (hydrograph) cartographic symbols.
These given on the map to make representation of the water body systems.
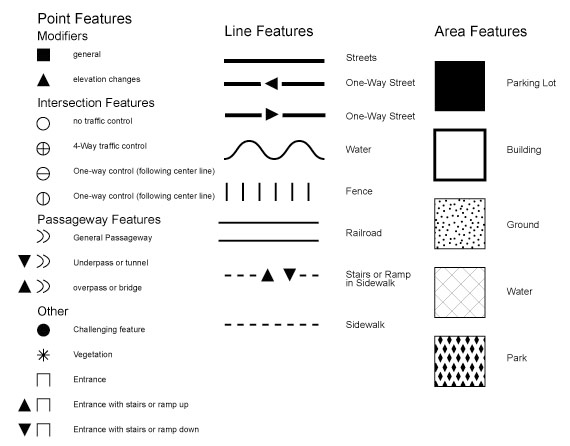
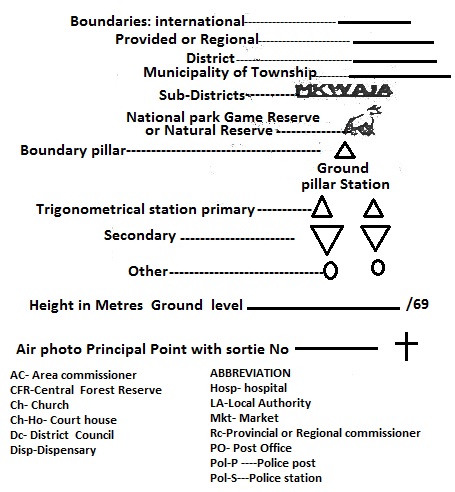
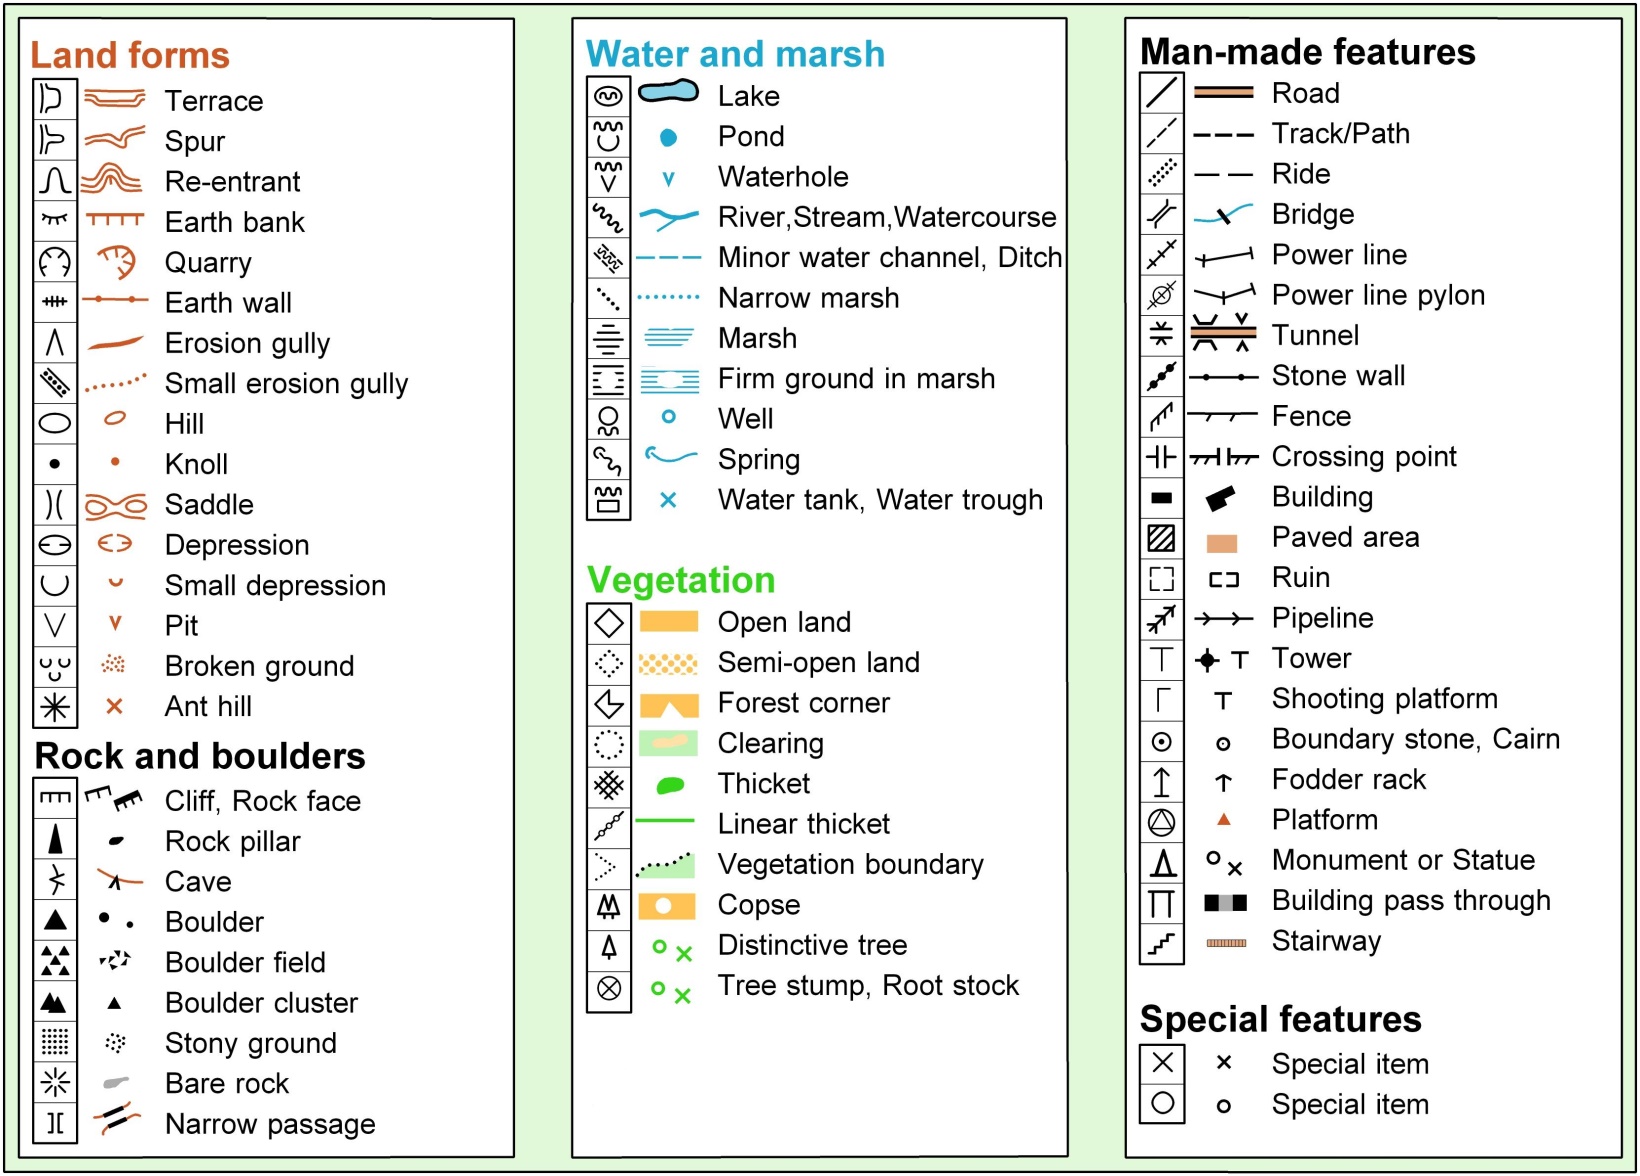
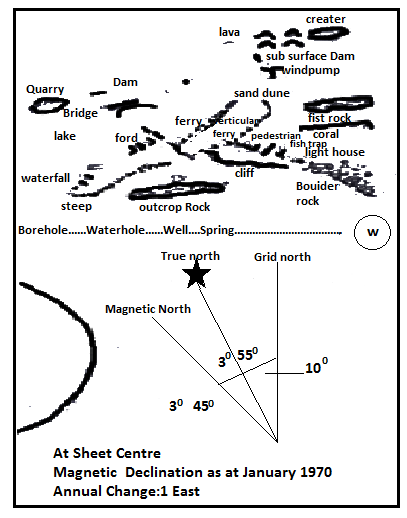
Asses yourself!
Are you able to define cartographic symbols and signs?
Do you understand the main qualities of cartographic symbols and sign?
Are you able to describe the different types of cartographic symbols and signs according to different elements of variation?
CROSS SECTION, INTERVISIBILITY, HORIZONTAL EQUIVALENT AND GRADIENT.
CROSS SECTION
Cross section is a transect diagram or topographical profile of an area drawn on a paper with details taken from the topographical map to show the structural appearance of the landscape in between of the two points. It is alternatively known as relief section or topographical profile.
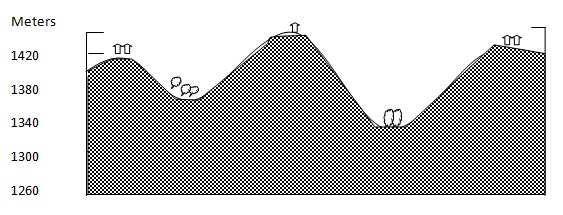
Cross section is of two types and include; the simple (sketch) and annotated cross sections.
Simple-cross section is the one not drawn to scale and is made to show the general appearance of the landscape between the given points in terms of relief.
Simple cross section is drawn after estimation of the general rise and fall of the landscape. The estimation is done after the study of the contours on the given map. Beside to this,
altitudes along the vertical lines not given.
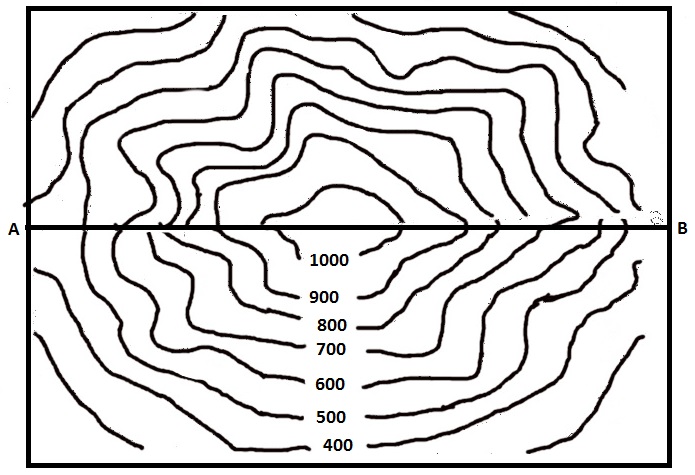
(i) An area to be sketched.
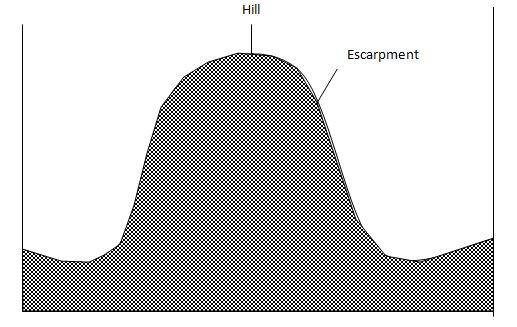
(ii) Simple cross section from A – B
The annotated cross section is the one drawn to scale and in which the position of important places and features indicated more accurately. It is also known as accurate cross
section.
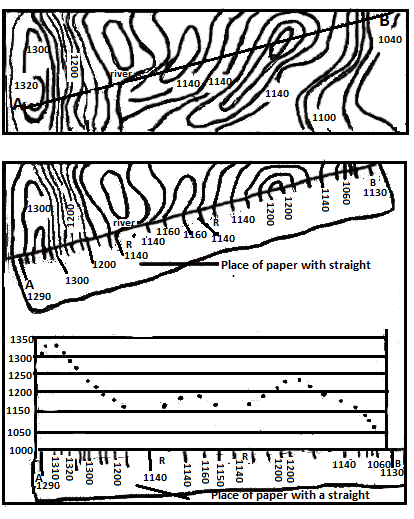
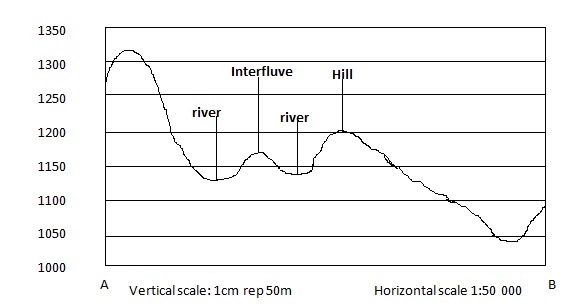
The significance of a cross section.
Provides a clear pictorial view on the structural appearance of area in between the two places. With respect to this, a person may easily determine types of slope in the area and the appearance of the area whether undulating or un undulating.
It is useful for indivisibility determination between two points in the area. This is made possible as a cross section shows physical appearance of an cross section shows physical appearance of area and if clearly observed, the judgment of indivisibility becomes easier.
It shows clearly the altitudes of the different parts of the landscape in between of the two points in the area.
Cross section aid in making of gradient determination of the sloped landscape by relating the VI to HE.
CONSTRUCTION OF THE CROSS SECTION
The construction of cross section should fundamentally follow the following significant steps.
1. Identify and mark the two end points to be sketched on the topographical map. The points can be identified by taking into consideration of the grid references or place names given.
e.g. A and B.
2. 2. Draw the straight line with the use of a ruler on the map to join the two identified points.
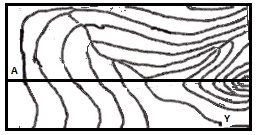
3. 3. Take a piece of paper with a straight edge, or fold it to get straight edge and place along the drawn straight line on the map. The piece of paper has to be slightly longer than the length of
the line joining the two end points.
On the piece of paper mark the following important details.
The two end points, which have been identified on the map.
Where every contour line cuts the line.
The contour heights.
The important landscape feature of both, natural and cultural features.
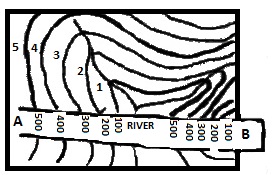
4. Find the appropriate vertical and horizontal scales. The vertical scale is determined as follows:-

According to the traverse on given contoured map:

Thus; VS, 1cm represents 100m.
Vertical scale shows the relationship of height between the cross section and the actual landscape represented.
Note.
The graph space for the vertical distance of cross section lies up on a decision. Graph space should conditionally produce the vertical scale that can not results into vertical exaggeration that appears more than 10 or less than 5 as related to horizontal scale.
The horizontal scale remains to be the same to that used on the map. This provides the relationship of horizontal distance to actual ground represented.
5. 5. Construct the framework for drawing the cross section. The framework should have both vertical and horizontal line distances. The horizontal line distance is determined by the length from one point to another on the map. The measurement of the vertical line has to correspond to the decided graph space.
6.Take the piece of paper which has been marked with the map details for cross section, and place along the horizontal line distance of the framework. Relate the height numbers to those allocated along the vertical line distance.
7. 7. Connect the plotted points with pencil using the free hand to develop the structural appearance of the landscape.
8. 8. Finish the cross section by including the following:-
Heading; To show what the cross section is for about.
Natural and cultural features; These if clearly indicated show the clear outlay of what is represented by the cross section.
Vertical scale; This shows the relationship of altitudes between the cross section and actual ground represented.
Horizontal scale; This shows the relationship of horizontal distance between the cross section and landscape represented.
Vertical exaggeration; It shows the relationship between vertical and horizontal scale of the cross section.
Key, if necessary.
North direction.
The source.
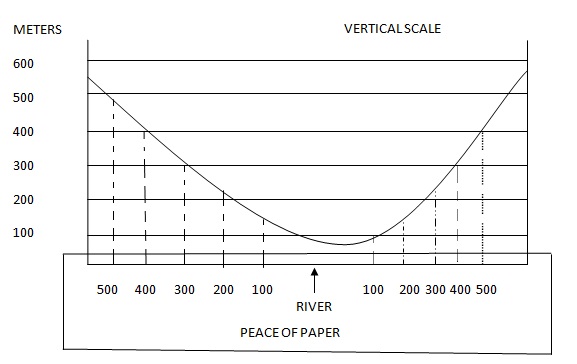
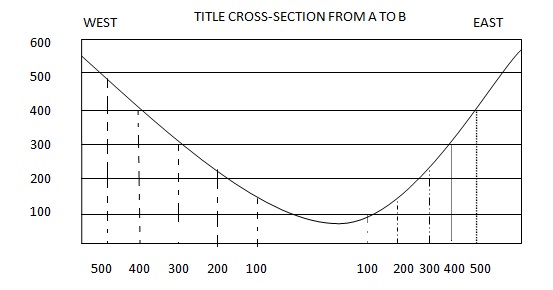
Horizontal scale ; 1:50,000
Vertical scale; 1:10,000
VE = 5
VERTICAL EXAGGERATION
A cross section by its nature has both, vertical and horizontal scales. The vertical scale is nearly always subjective, while the horizontal scale is steadily constant. The vertical scale by being subjective, it can be magnified. The amount of magnification of the vertical scale over horizontal scale is known as vertical exaggeration. Vertical exaggeration is thus, defined as the amount of times by which the vertical scale is larger over horizontal scale.
Or
The relationship between the vertical scale to horizontal scale of cross section.
Vertical exaggeration is very important in cross section drawing as it determines the shape of the features represented on the cross section.
The standard vertical exaggeration of the cross section drawn from most of the topographical maps with scale of 1:50,000, is that which does not exceed 10 units and not less than 5 units.
Vertical exaggeration is principally determined by applying either one of the following two principle formula:-
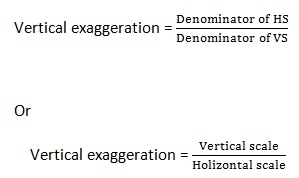
Example:-
If a cross section has the horizontal scale of 1:50,000 and vertical scale of 1:10,000, whose vertical exaggeration is determined as follows:-
![]()
According to the cross section:-
Horizontal scale = 1:50,000
Vertical scale = 1:10,000
Then; 50,000
10,000
Thus, the VE = 5. This implies the vertical scale is larger for 5 times to Horizontal scale.
INTERVISIBILITY
Indivisibility is the act of establishing whether the two positions in the area as observed on the map visible to one another or not.
A good way of realizing the indivisibility of two points on the map is by drawing a cross section from one point to another to view the structural appearance of landscape. On the cross section, draw a straight line called sight line to connect the two end points.
- If the straight line passes clearly between the two points, it implies the sighting from one point to another is not obstructed and hence, the two positions are intervisibility.
- If the land rises high above the sight line, implies that, the sighting from one point to another is obstructed thus, the two positions are not intervisibility.
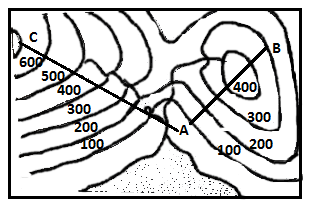
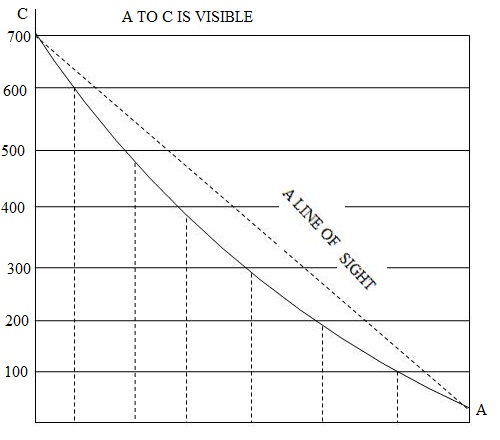
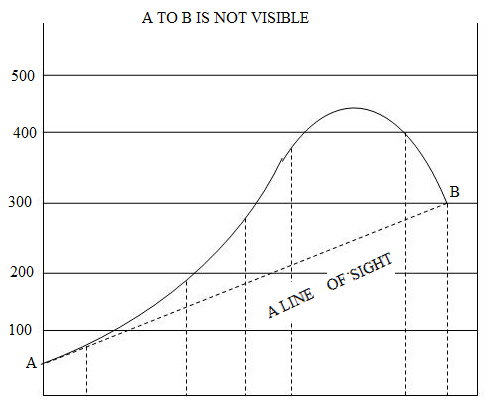
Factors affecting indivisibility.
Interivisibility between points on the map and up on areas on the earth’s surface effected by the following factors.
- Relief; Natural features like mountain, hill and others in between of positions, affect intervisibility.
- Vegetation; presence of thick forest in between of positions also affects intervisibility.
- Buildings; the presence of tall buildings in between two positions also hinder intervisibility.
HORIZONTAL EQUIVALENT (HE).
Horizontal equivalent refers to a horizontal distance of the sloped landscape in relation to its vertical height.
Horizontal equivalent can be high, low or nil depending on the degree of a slope steepness.
Gentle slope; gives higher horizontal equivalent.
Steep slope; gives low horizontal equivalent.
Vertical slope; gives low horizontal equivalent
Horizontal equivalent is worked by converting the CD into AD with respect to map scale.
Example:-
Scale is 1cm=½km
CD = 10 cm
10 x½km =5 km Or 5000m.
Thus; the horizontal equivalent is 5,000m or 5km.
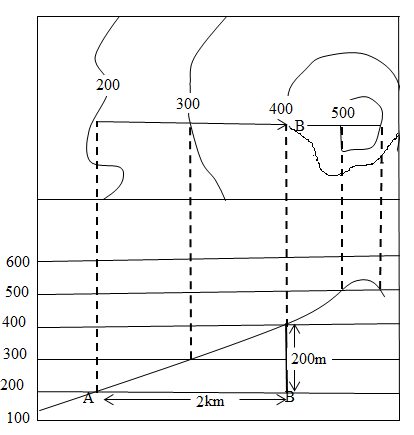
GRADIENT
Gradient is a degree of slope steepness; or the ratio between the vertical interval (increase) to horizontal equivalent; or the amount of rise or fall in meter or feet of the land in relation to horizontal distance.
Gradient is determined by the following principle formula:-
![]()
Where by:
VI=vertical interval; It is the difference in height meter or feet between the highest and lowest altitudes of the two recommended points.
HE = Horizontal equivalent; It is the distance between the two given points as measured from the map.
Procedure for gradient determination.
Identify the two points and name them like A and B.
Join the points using a straight line to form line AB.
Measure the ground distance between the two points.
Calculate the actual distance using map scale given to get the horizontal equivalent (HE).
Calculate the difference in height between the two points using the contours.
Using the formula to have the gradient.
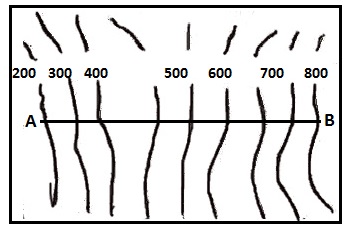
(a) Gradient of a slope from point A to B
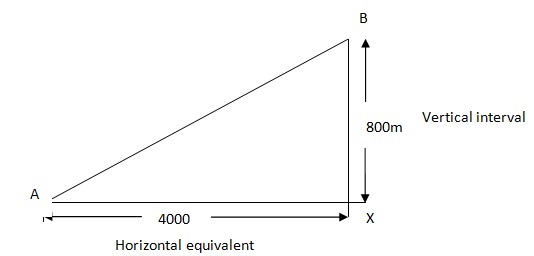
![]()
According to the given case on the map;
Highest altitude = 1,000 m
Lowest altitude = 200 m
CD = 8 cm
Scale; I cm represents 0.5km.
Then;
1,000m – 200m
(8 x 0.5km) x 1,000m
800 = 1
4,000 5
Thus; the gradient is 1 in 5. This implies there is a rise of 1 m high in every horizontal distance of 5m from A to B Or there is a fall of 1 m low in every horizontal distance of 5 m from B to A.
Average Gradient.
Average gradient is a degree of slope steepness for the elongated feature.The elongated feature can be of like a road, river, railway and others of the same nature.
Procedure for average gradient determination.
Identify the two points of the elongated feature.
Measure the length of the elongated feature on the map to get the CD.
Convert the CD into AD b using map scale to get HE.
Calculate the difference in height of the feature using the contours.
Using the formula to have the gradient.
Example:-
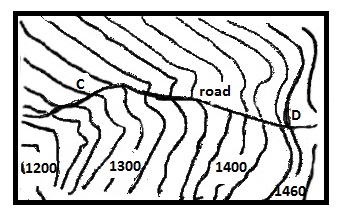
The average gradient for the road is determined as follow:-
![]()
According to the given case on the map;
Highest altitude = 1,460m
Lowest altitude = 1280m
CD =12cm
Scale; 1cm represents 0.5km.
Then;
1,460m – 1280m
(12 x 0.5km) x 1,000m
1180 = 1
6,000 5
Thus; the average gradient of the road is 1 in 5. This implies; the road experiences a fall or rise of I m low and high respectively in every horizontal distance of 5m in between of points C and D.
Asses your self!
Are you able to define a cross section?
Are you able to describe the kinds of cross section?
Are you able to narrate the significance of drawing a cross section?
Are you able to draw a cross section?
Are able to narrate the factors affecting intervisibility?
Are your able to suggest intervisibility by considering cross section and affecting factors?
Are you to define horizontal equivalent and gradient?
Are you able to calculate gradient and horizontal equivalent.
EXERCISE
Qn. Calculate the gradient between Fotobiro hill and the point at grid reference
040640 (necta 2002 – Extract map of Nyakwere).
Qn. On the map drawn on scale of 2cms to 16 kms, there are two towns, A (altitude 800 meters and B altitude 1200 meters).
(i) calculate the gradient of the slope if the distance between the towns measures 4.2 cm the map.
(ii) Find the vertical exaggeration of the cross section if the vertical scale is 1:80,000. (NECTA 1997).
Qn. Draw a cross section from Mahenge peak and the western peak of Wibete
hill. (NECTA 1993; Extract map of Dodoma West sheet 162 /1).
Qn. The airfield and the top of the hill at Ilboru are 6.6kms apart. Calculate the
gradient between them (NECTA 1992; map extract part of TANZANIA – ARUSHA sheet 55/3).
Qn. Construct a neat annotated cross section from grid reference 630770 to 740770 (NECTA 1980 – the map extract part of TANZANIA – MONGOYO (Series Y742 sheet 295/1 Edition 1 TSD).
Qn. How would you determine the following on a topographical map?
Stream gradient.
Vertical exaggeration.
Horizontal equivalent (NECTA – 1983).
Qn. (i) Draw a cross section from Grid 360280 to 460330 and show area with plantation agriculture and the three major rivers.
(ii) calculate the vertical exaggeration.
(NECTA 1992 map extract part of TANZANIA – ARUSHA sheet 55/3).
Qn. Draw a cross section from point A to B , and calculate the vertical
exaggeration (NECTA 1989).
Qn. Determine the average gradient of river Kwamu kwme from grid 234626 to grid 196596. (NECTA – 2001, the map extract of KONDOa (sheet 104/4).
Qn. Calculate the gradient from Gr 000315 to Gr 020320. (NECTA – 1999, the map extract of BABATI (Y.742).
Qn. Calculate the vertical exaggeration for a topographical section across a map whose horizontal scale is one to one km and the subdivision of the vertical scale being one cm representing 50 m. (NECTA 1988).
RELIEF FEATURES IDENTIFICATION ON TOPOGRAPHICAL MAPS
Topographical maps show numerous relief features of areas represented. The relief features are widely shown by means of contours. Usually contours on maps occupy patterns with respect to the shape of the landforms (relief features). The identification of landforms on the topographical map is by looking the patterns of the contours as well as their numbers. This can be aided by drawing a cross section.
Identification of the varied landforms on the topographical maps with respect to their shape is as follows
1.Hill.
Hill is a rounded up land not as high as mountain.
Or
As small rounded upland of low height above the surrounding area.
On the topographical map, hill is recognized by the presence of roughly circular contours close together and the last highest contour round small space on the map.
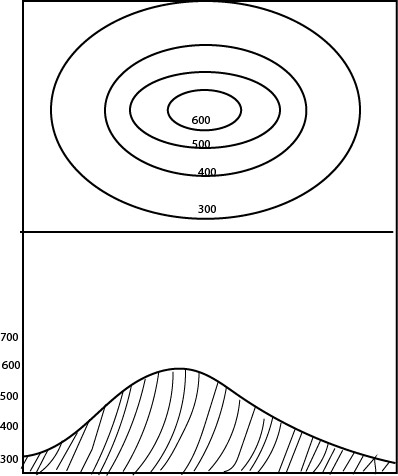
2. Plateau.
A plateau is an extensive upland with steep slopes and fairly gentle slope or flat on the top surface.
On the topographical map, plateau owning to its nature is recognized up on the presence of roughly circular contours close to one another but, the last highest contour rounds a large space on the map
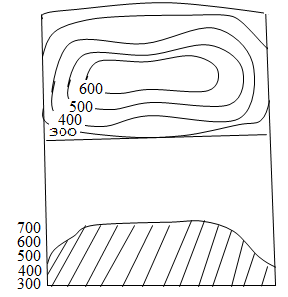
3. Ridge.
Ridge is a big, narrow and long with steep slopes. It is recognized if there is the presence circular elongated contours close to one another.
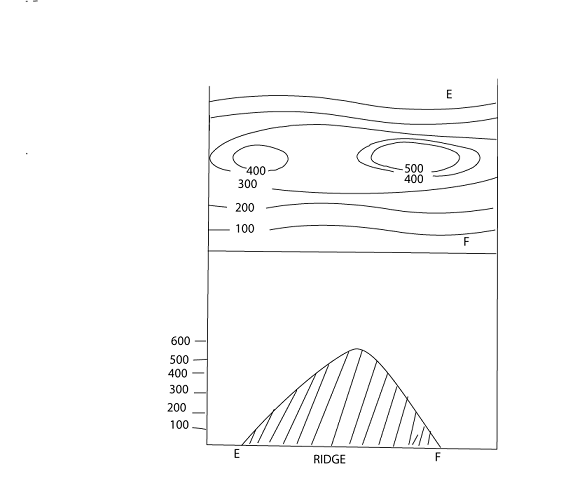
4. An escarpment.
It is an upland that has gentle slope on one side and steep slope on the other side. On the topographical map, escarpment is recognized if there is the presence of roughly circular contours observed be very close to one another at one part and far part at the other side.
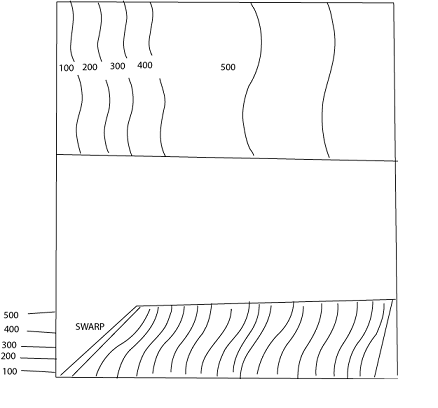
5. Slope.
Slope is a slanting piece of landscape. Or the ground that progressively falls or rises from one area to another.
There are five types of slopes and include:-
Steep slope.
Gentle slope.
Concave slope.
Convex slope.
Vertical slope.
(a) Steep slope.
Steep slope is the one that has high degree of steepness evenly from the top to the bottom. Steep slope is recognized if on a topographical map, contours lie evenly spaced much close to one another from the top to the bottom.
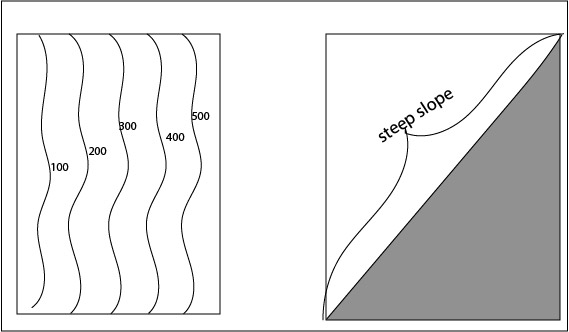
(b) Gentle slope / regular slope
Gentle slope refers to a kind of slope that has low degree of steepness more evenly from the top to the bottom.
On the topographical map, gentle slope is recognized if contours indicating the presence of slating land, observed to lie far apart evenly spaced from the top to the bottom.
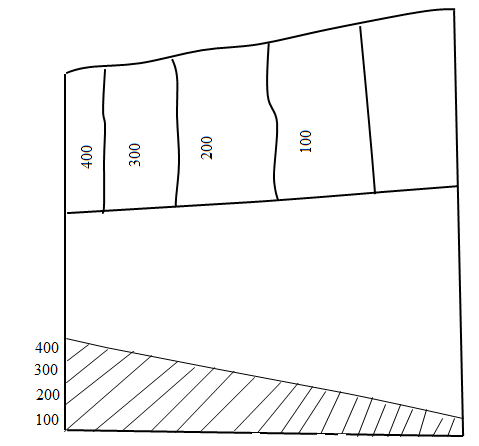
(c) Concave slope.
It is a slanting land, which is steep at the top and gentle at bottom. Or a slope that appears to have high degree of steepness at the top and low degree of steep at bottom. Concave slope is recognized if the contours indicating slanting land, observed to be closely spaced at the top part and wider apart at the bottom.
(d) Convex slope.
It is the slanting land which has low degree of steepness at the top and high degree of steepness at the bottom. The contours of convex slope are close to one another at the bottom and wider apart at the top.
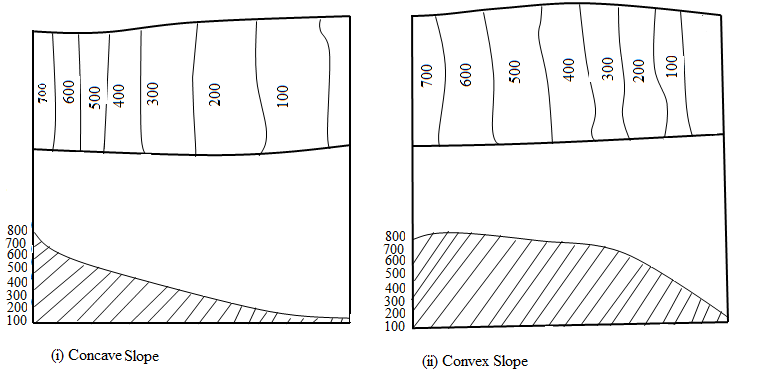
(e) Vertical slope.
It is the slope that has right angle steepness of about 90°. It is recognized if contours of different elevation join and form a single contour line.
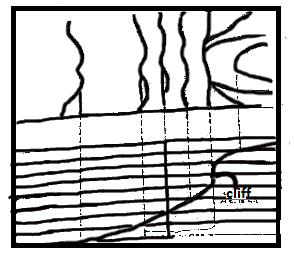
6. Saddle or Col.
A saddle or col is a low lying land in mountain range, which connects two mountain peaks or hill. The contours of a saddle or col that enclose two mountain peaks or hills, run roughly parallel and are far apart at the low lying land.
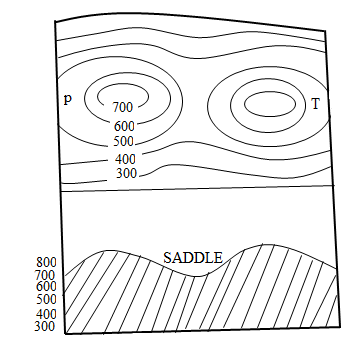
7. Pass.
Pass is a gap through a mountain allowing a through passage to different directions. Pass on the map is recognized, if contours of mountain peaks roughly converge towards a low-lying area.
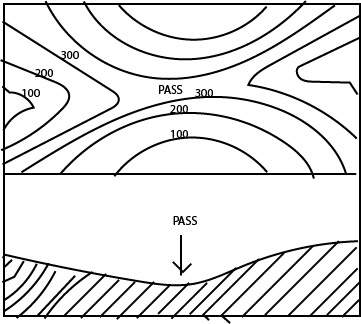
8. Watershed.
Watershed is a line dividing the headwaters of two or more streams flowing to different directions. On the contoured map, watershed is recognized provided the highest contours run parallel to each other and streams of water appear to diverge to different directions.
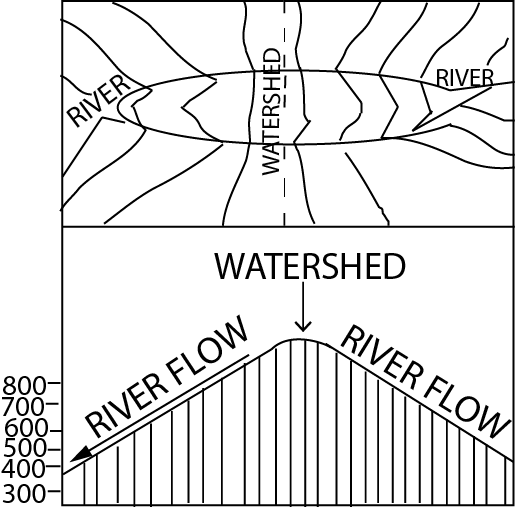
9.rRr River valley:-
River valley is a long narrow and deep depression through which a river
flow. On the topographical map river valley, is recognized if the contours form V shape and the river crosses each contour.
figure here
10. Spur:-
Spur is a projection of land or broad tongue of land from the side of a hill or mountain towards the valley. Spur is recognized if the contours form a V shape pointing down low lying area.
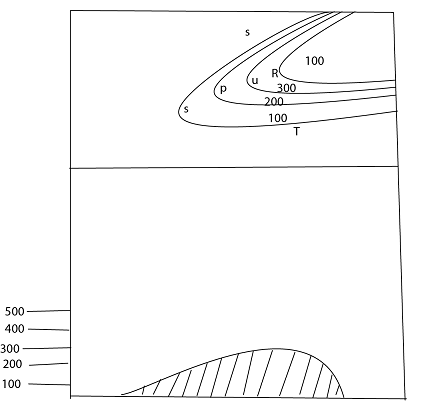
11. Gorge.
Gorge is a deep, narrow, steeply sided river valley. The contours of a gorge are close together forming a narrow V shape pointing sharply up-stream and the river crosses each contour.
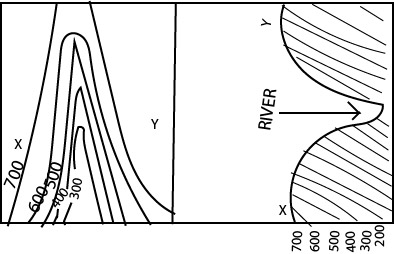
12. Flood plain
A flood plain is a flat low lying area lies immediately after river channel built up by deposition of alluvium. Flood plain on the map is recognized if the contours run roughly parallel to the main river and the lowest contours are spaced enough in a way that, it marks a general width of the flood plain.
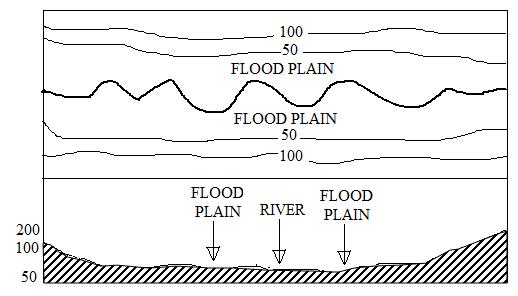
13. Delta:-
A delta is a flat low lying area of alluvial deposits at the mouth of the river crossed by many distributaries. On the topographical map, delta is recognized if the lowest contours follow roughly the area with tributaries.
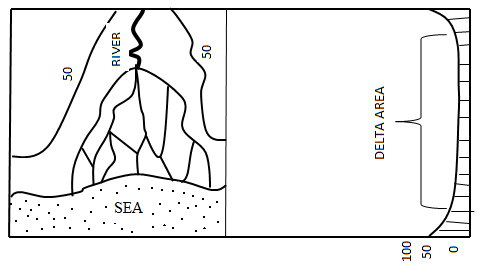
14. Estuaries:-
An estuary is a single broad river mount where a river enters a lake or sea. The contours of an estuary are widely spaced forming the wide V shape that point up stream.
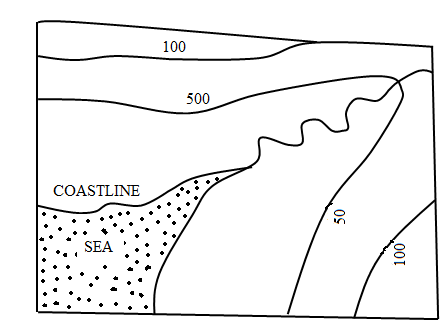
15. Cliffs.
A cliff is a high rock face along a coast, river or lake. On the topographical map, cliff may be indicated in two ways.
(a) A cliff may be shaded by short lines drawn at right angles to the coast, river or lake to indicate the steepness of it.
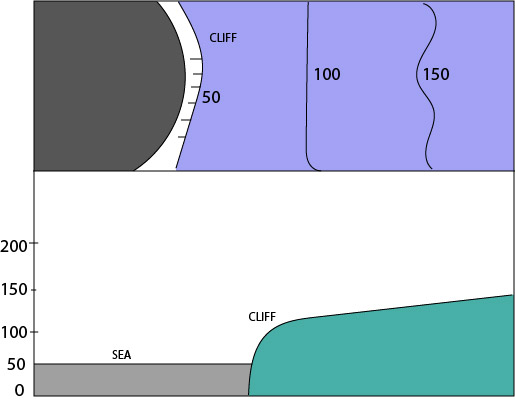
(b) Cliff on the topographical map may also be observed by the presence of contours of different elevations, join and form a single contour line parallel to the sea, lake or river.
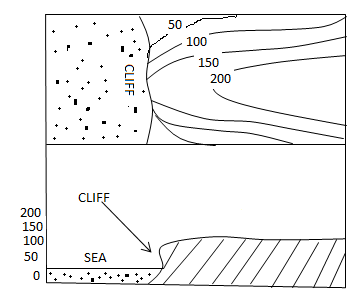
16. Levees:-
Levees are the natural embankments built up by a stream along the edges of its channel. On a topographical map, the embankments are shown by pecked lines at right angle to the course of the river.
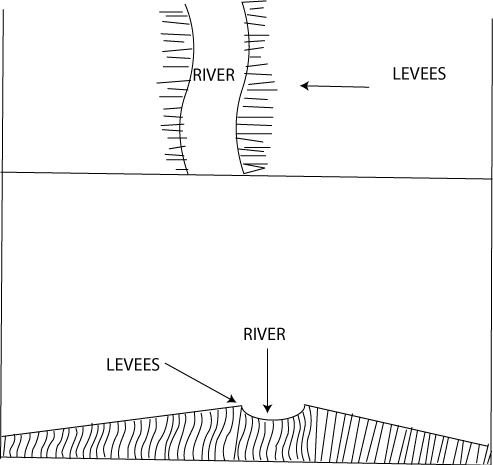
17. Coral fringed coastline.
Coral fringed coastline is formed by a coral platform which lies close to the shore. On a topographical map, the coral fringed coastline is marked clearly by shading or by using symbols to show the area with coral fringing reef in the sea.
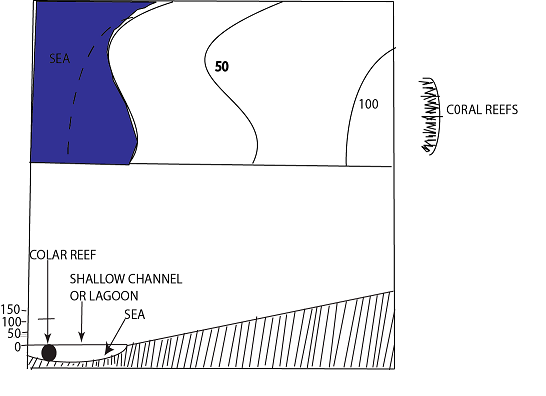
Asses your self!
Do you understand the nature of landforms commonly shown on topographical maps?
Are you able to identify different landforms the topographical map by considering the pattern of contours.
EXERCISE:-
Qn. (i) Describe the land forms shown on the map.
(ii) Mention two factors which have influenced the direction of tributary into tributary R
(iii) Identify the feature at Y. (NECTA – 1988).
Qn. Describe the major landforms depicted on the map. Use the specific examples from the area (NECTA 204, the map extract of Mwanza sheet 33/2).
Qn. What type of landforms are depicted on the map? (NECTA 2008).
Qn. What features are found at grid reference,
(i) 960200? (ii)01139?
(NECTA -1993, map extract part of Tanzania-Dodoma west Sheet 162/1).
Qn. Identify the features found in the following grid readings
(I) 690110 (ii) 579145 (iii) 674063 (iv) 553123
(NECTA 2012-Uyole extract map sheet 245/3).
MAP INTERPRETATION
Map interpretation is the art of examining the given topographical map to realize the reliable geographical details of an area represented. Geographical details may include; climate, economic activities, relief, mode of transport etc.
Map interpretation is done by looking the conventional symbols and signs on the map and realize what they stand for. Map interpretation has to entails two basic processes of map reading and map analysis.
Map reading; It is an art of examining the given topographical map to recognize the features that directed on the map.
Map analysis; It is the art of relating the features that appear on the map to other geographical facts which are required to be described, explained or suggested.
In the process of map reading; carefully read and note; the map conventional signs and symbols, key the date of compilation, title, north direction, latitude and longitudes, and other important marginal details. However the perfect skill for interpretation of the topographical maps requires constant practices and wider geographical knowledge.
With map interpretation; some one is able to describe and explain the following geographical details:-
- Climate.
- Human activities.
- Vegetation.
- Drainage.
- Geological nature.
- Relief.
- Geomorphologic processes.
- Communication.
- Population distribution and settlements.
1. CLIMATE
Climate is the average (overall) weather conditions experienced in an area especially large area for a long period of time or through out. It is thus; realization and description of climate of an area from the topographic maps is by taking into consideration of the facts much related to climate which commonly shown on the map. They considerably include the following:-
(i) Latitude:-
Climate conditions vary considerably from one latitude region to another. It is thus; if the latitude region in which the mapped area is found observed, map user may realize the more likely climatic conditions of the area with regards to the wider geographical knowledge the person has.
The latitude region is recognized by taking into consideration of the degree numbers indicated along the map edge from bottom to the top or from south to north. Such degree numbers are of latitude values. Therefore; once you are given a topographical map to establish the climate of the respective area, try to observe the latitudes of the mapped are to understand in which geographical position over earth’s surface the mapped area represented is located.
For instance:-
If the mapped area understudy is located from or in between 0° – 5° north and south of the equator, it implies that, the area is located in the equatorial belt.If other considerations remain constant, the area is suggested to experience equatorial climatic pattern with the following conditions:-
High rainfall through out the year with two maxima peaks i.e. there is no prolonged dry season.
High temperature throughout the year with small annual range.
If the map along its edge shows any latitudes in between of 6° – 20° North and south of the equator. It implies the area represented on the map located in tropical region. If other considerations remain constant, the area is judged to experience tropical climatic type with conditions of:
-Moderately high rainfall which varies annually i.e. there is the presence of both wet and dry seasons in a year.
-Temperature is high with great annual range.
However; if the altitude is below 500m; the area can be suggested to
have coastal tropical climate with long rain season; but if altitude is above 500m, the area can be established to have continental (interior) tropical climate.
Note.
It is important for the map users to be aware with the climatic conditions experienced in varied natural regions.
(ii). Altitude.
Altitude means the height of an area from the mean sea level. Altitude has a considerable impact on climate as temperature and rainfall regime is influenced by altitudes. It is therefore, the consideration of altitude of an area from the map, may help to suggest the likely climatic conditions. With respect to this, once you are given a topographical map to suggest climate, consider the altitude of the area by reading the number of contours, spot height, bench mark and trigonometric points to realize whether the area represented on the map is of lowland or high land.
If the altitude is higher mostly above 2000m implies the area represented is of much highland and likely to experience highland climatic pattern featured by high rains of orographical type which may vary with aspect and low annual temperature as greatly lowered by higher altitude.
If the contours and other means show low height numbers, give an impression that, the area is of lowland and likely to experience high temperature.
(iii) Water bodies (drainage).
Drainages are very good guides to climate particularly on the relative amount of rainfall. It is so as the sources of water bodies in any are on the earth’s surface is mostly by the amount of rain fall received.
Presence of the salt lakes, seasonal streams, boreholes, seasonal swamps and widely spaced streams suggest that, the rains in the area are seasonal with long period of dry conditions.
Presence of abundant permanent streams and permanent swamps, suggests heavy rainfall received in the area.
Presence of the sea, suggests maritime (coastal) climate.
Presence of lake particularly that of Victoria reflects lake equatorial type of climate.
(iv) Natural vegetation and crops
Natural vegetation and crops shown on the map have reflection to certain climatic conditions and thus; are also good guide to climate.
Natural vegetation
Presence of thick forests on a map and up on the respective area indicates high annual rains.
Woodland vegetation reflects moderate high annual rains.
Scrubs, scattered trees and thickets vegetation reflect seasonal rains.
Crops.
Crops are raised depending on the climatic conditions that favour their growth. Hence; the consideration of crops cultivated, helps to deduce temperature and rainfall conditions of an area observed on the map.
Presence of coffee and tea on the map and up on the area represented, suggests cool wet climate.
Presence of cotton, sisal and cashew nuts suggests moderately high seasonal rainfall and high temperature.
NOTE.
Always the suggestion of climate of an area from the topographical map, students should not rely on a single guiding fact. Consideration should be centered on more than one guiding facts. It is so in a basis that, climate is influenced by a number of varied factors. It is thus; one considered factor, may not give the absolute reality about the climate of an area.
In East Africa from which most of the topographical maps for examination purpose extracted, the following types of climate experienced.
Tropical climate.
This is experienced over most of Tanzania exception in dry region of the central Tanzania. The climate is characterized as follows.
High temperature with great annual range and in high plateau temperatures bit lower as result of high altitude.
The amount of rainfall is moderately high and occurs in one season.
Sub tropical climate:-
It is the type of climate experienced in high land areas with in the equatorial belt. It is very common in Kilimanjaro, Kenya highlands, Kigezi, Ngara and Karagwe. The sub tropical climate is characterized as follows:-
Desert and semi desert climates:-
This type of climate is experienced in areas of central Tanzania, Northern Kenya and North eastern Kenya; and north eastern Uganda. Desert and semi desert climate is characterized as follow;-
Temperatures are high around 27°C with very high annual range.
Annual rainfall is generally low with long dry season.
Coastal Tropical climate.
This type of climate experienced along the coast of East Africa and its islands. The climate is very common in Dar es Salaam, Mombasa, Tanga and others coastal areas.
The costal tropical climate is characterized as follows:-
Long heavy rain season.
Temperature is high with great annual range.
Lake equatorial climate.
This is experienced around lake Victoria, in Tanzania, Kenya and Uganda. The climate is characterized by the following conditions:-
Moderately high temperatures.
Moderately high rain rainfall.
Important climate description hints.
Produce a statement in connection to what is to be described about climate.
Give the type of climate and its conditions.
Establish the evidences to reinforce your description (suggestion).
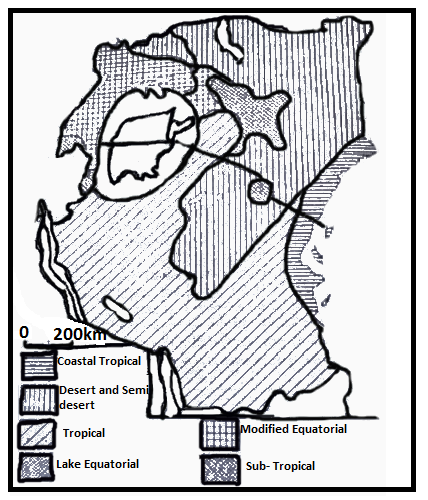
For instance:
Qn. Describe the climate of the area.
ANSWER
Climate of the area being the overall weather conditions as observed from the given extract map is described as follows:-
The area is realized to experience equatorial climate featured by high temperatures with small annual range and high rainfall through out the year.
The realization of climate is supported (reinforced) by the following evidences as observed from the map.
The area is of latitude of 2° indicated along the map edge. Also it is of low altitude. Commonly low latitude sustain high temperature being a feature of the recognized climatic pattern.
Cultivation of cocoa reflects high rains which is also a feature of equatorial climate.
EXERCISE
Qn. With precise pieces of evidence propose the climate of the area shown on the map. (NECTA 2004, map extract of Mwanza sheet 33/2).
Qn. Suggest the possible climate of the area. (NECTA 1993, the extract of part of Tanzania (sheet 162/1).
Qn. Giving evidence from the map, suggest the climate of the area. (NECTA 1987, the extracts series Y 742 sheet 55/3 or ARUSHA).
Qn. Using evidence from the map, suggest the possible climate of the area (NECTA 1989).
Qn. Describe and account for the climate of the area (NECTA 1985, the extract part of Tanzania provide (sheet 55/3 series Y 742).
Qn. Comment on the possible climate of the area. (NECTA 2007, Extract map of West Hai).
Qn. Given topographical map of an area what indicators can be considered in deducing the climate of the area (NECTA 1983).
Qn. Describe how the relief and vegetation can help the map reader to depict climate on topographical maps. (NECTA 1997).
2. VEGETATION
Vegetation refers to a total assemblage of plant cover in an area. Topographical maps show vegetation with reflection to actual areas represented. It is thus; topographical maps may guide map users to realize the vegetation of an area represented.
The forms of vegetation present in East African areas of which commonly shown on topographical maps include the following:-
Forests:- The vegetation of more close trees; or The vegetation largely dominated by dense growth of tall trees with closed leaf cover or canopy. These develop in regions with high annual rains.
Woodland:- The type of vegetation of less closely big trees. These grown in areas with moderately high annual rains.
Thicket :- This type of vegetation is of dense shrubs (closely shrubs) and some scattered big trees. Such vegetation nature commonly found in regions with moderately high seasonal rains.
Scrubs:- The vegetation of less closely shrubs with widely scattered trees. Such vegetation commonly found in areas of annual seasonal rains with long dry season.
Scattered trees:- These are the vegetation of widely spaced trees. These also commonly found in areas of seasonal rainfall.
Planted vegetation:- Theseare more particularly of the cultivated plants (crops) like sisal, tea, coffee, cashew nuts and others.
The appearance of the distinctive vegetation forms on the topographical map is as follows:-
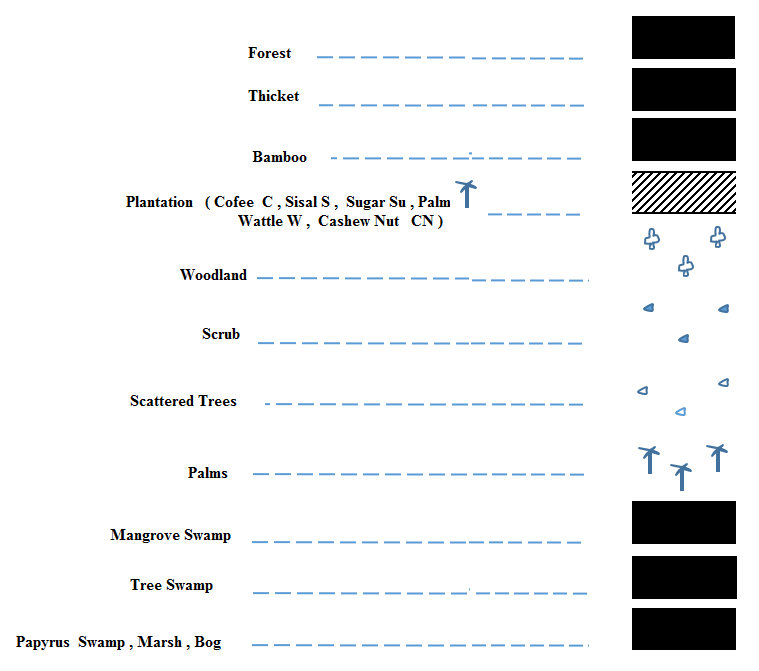
Vegetation on most of the topographical maps and up on the actual areas represented extremely varied in nature and distribution because of the following factors.
Climatic conditions
High annual rains develop forest vegetation featured by the dense growth of trees.
Moderately high annual rains develop woodland vegetation featured by the less closely trees.
Moderately high seasonal rains develop thicket featured by the growth of closely shrubs.
Seasonal rainfall makes occurrence of scrubs and scattered trees.
Relief.
It is considerably the physical appearance of an area. This influences vegetation relatively to soils and drainage as follows:-
Where the landscape is steep as on a map contours observed to lie much closely to one another, drainage is good, but soils can be shallow. This may give to poor coverage of plants.
Where the landscape is almost level as on the map contours observed to lie much more far apart, deep soils develop, but the area subjected to poor drainage. This also may make poor plants growth e.g. areas of seasonal swamps.
Where the landscape is gentle sloped as on the map contours observed to lie far apart, may have deep well drained soil. This may make good coverage of plants.
Soil:-
Soil has ideal influence to plants growth in the following ways:-
Fertile soil by being deep well drained makes good growth of plants. Such soil sustained where the topography is gentle sloped; and on the map can be realized if contours lie less closely to one another.
Poor soil by being shallow, water logged makes poor growth of plants.
Human activities:-
Areas under human utilization like; scattered cultivation and settlements, plants have been removed and thus; subjected to have poor coverage of plants.
It is unlike to areas that not subjected to human utilization, can be observed to have good coverage of plants if other factors are also favorable.
Important vegetation description hits.
To describe vegetation, carefully study the map key to recognize the conventional symbols representing vegetation and relate to map face. After this the following hints can be given.
Identify the types of vegetation shown on the map like, forest, woodland, scrub e.t.c.
Give the distribution of each identified type of vegetation.
Describe the extent of coverage of each identified type of vegetation.
EXERCISE
Qn. Explain the factors that have influenced the distribution of vegetation of
the mapped are (NECTA, 2006. The map extract of Mpanda 153/30).
3. DRAINAGE
Drainage is the removal of surface water from an area by the system of both natural and man made water bodies like of rivers, lakes, swamps, ditches, canals and other related systems. The common drainage systems of areas which normally observed on the topographical maps include the following:-
1. Swamps:-
A swamp is a body of shallow stagnant water that normally occupies an area of flat low lying land. Swamps normally found where the ground forms a shallow depression or is extensively flat. Swamps make drainage by receiving water drained into them by the streams of water flow in wet season.
Swamps are of different types and are shown using different symbols. The swamps are explained in the key of topographical map.
The different types of swamps include the following:-
Mangrove swamp:- These on the topographical maps can only be found along the parts of the sea shore. This is because mangroves only grow in salty sea water.
Tree swamps:- These are the water waterlogged areas which have trees and other smaller plants growing in them.
The papyrus swamps:- These are dominated by papyrus plants.
Marshes:- These are dominated by grasses like plants.
A bog:- It is water logged spongy ground with a surface layer of decayed vegetation.
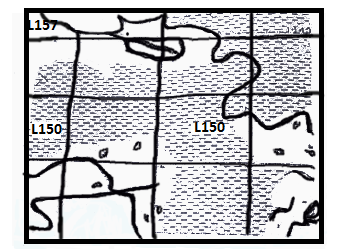
2. Sea:-
It is a large extensive body of salty water. This makes drainage by receiving water discharged into it by rivers. The sea is usually shaded in stipples (very small dots).
3. Lakes:-
These are bodies of water that occupy a basin, depression or hollow on the earth’s surface. They make drainage by receiving water drained into them by rivers and form an important inland drainage system areas.
4. Reservoirs:-
These are the human made lakes which formed when people build dams across streams or rivers.
5. Ponds:-
A pot is a small area of stagnant water which is commonly found along the stream courses. Most of the ponds are shown on the map using a dark blue tint.
6. Waterholes:-
A water hole is a shallow broad pit constructed by people. It is meant to trap rain water for animals to drink. It is shown on the map using the initials WH and a small circle which precedes the initials. i.e. oWH.
7. Ditches:
These are the trenches constructed in water logged areas for the purpose of draining water from the land. On topographical maps are shown by straight blue lines and the word ditch commonly written along side the line.
8. Rivers:-
A river is a mass flow of water in a natural channel from the area of upland towards the area of lowland where is likely to discharge its water.
A river can be permanent or seasonal. Permanent river can be topographical maps shown by irregular blue lines, and if the river is considerably big, the line appears thickened. While; the seasonal rivers are shown by the broken blue irregular lines. It has to bear in our mind that, some places have rivers which disappear as water percolates into the ground. Rivers of this nature on the map shown by continues irregular lines which end abruptly.
Drainage system of rivers occupy patterns depending on how tributaries converge to the main river and the general appearance of both consequent and subsequent streams. Drainage pattern is thus; defined as a layout made by the rivers on the landscape or is the shape produced by the arrangement of tributaries and main-river in a catchment area.
The patterns of rivers is the result of certain determinant factors which include the following.
Slope of the land.
The nature of the underlying rocks.
The general relief pattern of an area.
The common river patterns of areas appearing on topographical maps include the following:-
(i) Dendritic pattern:- It a drainage pattern in a shape of a tree trunk like structure with tributaries converged to the main river at acute angle resembling the shape of a tree like a feature. It develops on landscape of uniform rock hardness and structure and on gentle slope landscapes. It is very common in areas of igneous rocks.
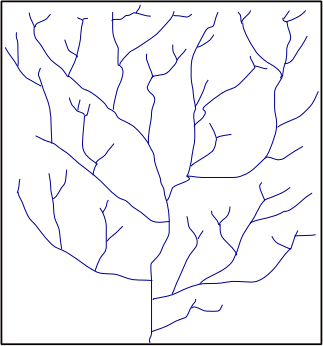
2. Trellis or rectangular drainage pattern.
It is a pattern which occupies a shape of a lattice with tributaries converging to the main river at almost right angle. It develops on a catchment’s area whose landscape has variation in rock hardness and structure. It may also occurs in areas of faulted landscape.
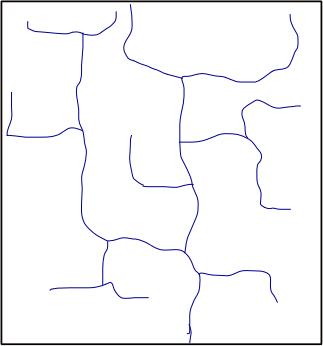
(ii) Radial pattern:- It is a drainage pattern whose tributaries diverge outwards down from the summit of rounded highland to different directions forming a shape of spokes round a wheel like structure. It is common to areas of roughly circular hills of igneous rock.
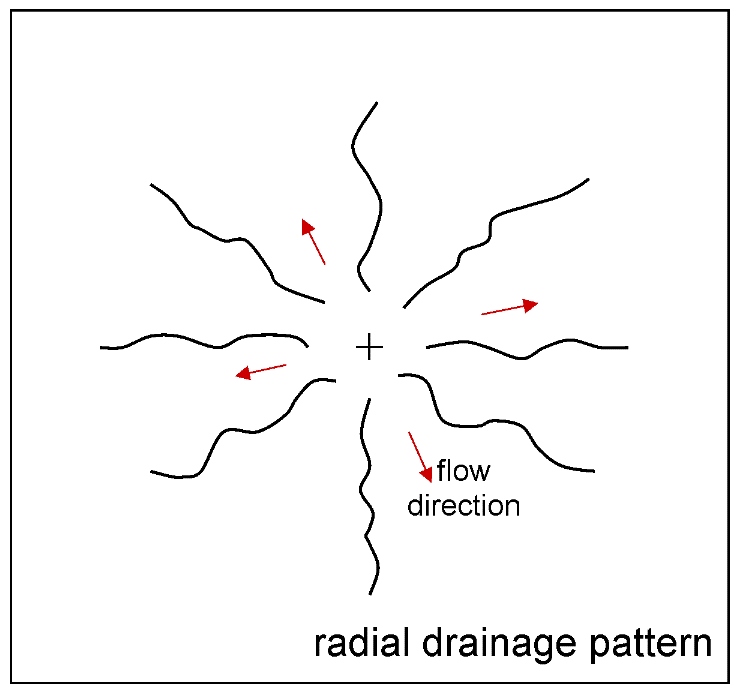
(iv) Centripetal pattern:- It is the one whose tributaries flow from different directions converging at a center of down warped landscape, where there is a swamp or lake. It is largely controlled by the shape of the landscape
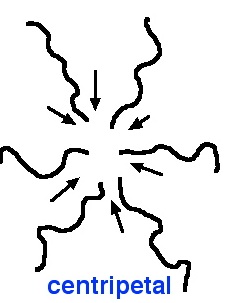
.River course (stage) identification
It has also to be noted that, a river has its course if development marked with three stages of life cycle. The stage of a river on a topographical map can be identified as follows:-
(i) Youthful stage.
It can be easily identified by the presence of the following;
The narrow V – shape contours like arrow heads pointing up to highest ground.
Very close contours along the river course, which represent steep valley sides.
Lack of meanders.
Absence of a flood plan.
Very few tributaries.
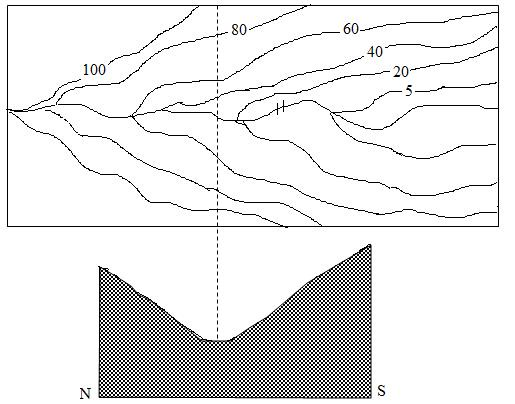
(ii) Mature stage:-
It is recognized by the following facts on the map.
Contours have a U – pattern crossing the river at wide interval which represent more gentle gradient.
The landscape is fairly flat with a narrow flood plan on either side of the river.
Presence of many tributaries.
Low degree of meanders.
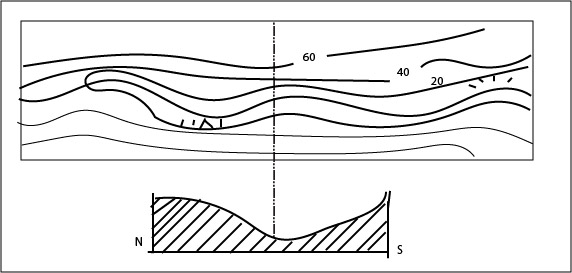
(iii) Old stage.
It is observed by the following facts.
The presence of a very gentle gradient of the river course.
Contours are very far apart cross the river.
More pronounced meanders.
The presence of a river broad flood plain.
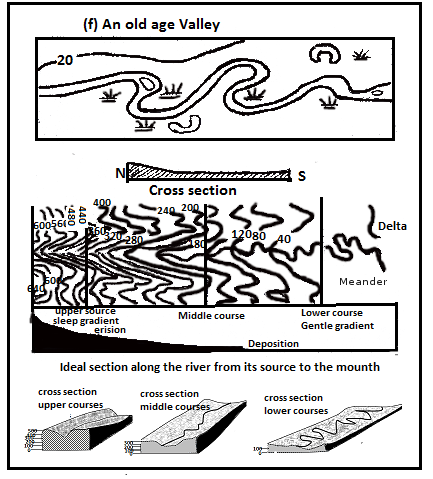
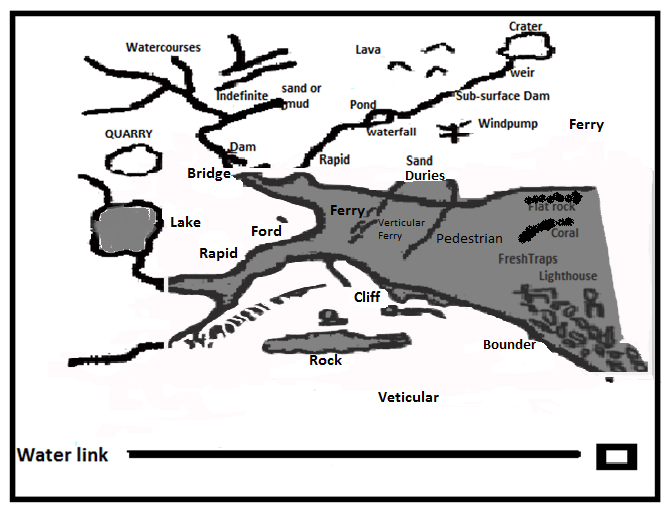
Factors influencing drainage systems.
Drainage systems observed on topographical maps with reflection to
actual areas represented are the result of the following determinant factors:-
(a) Climate.
Occurrence of rainfall, supply water to surface which then development to water body systems of rivers, swamps and others as follows:-
Heavy and continues rains, make areas to have permanent rivers and permanent swamps.
Seasonal rains make areas to have seasonal rivers and seasonal swamps.
(b) The nature of underlying rocks:-
Impermeable underlying rocks influence the occurrence of swamps. This moreover makes rivers to flow steadily regular as water is in difficult to percolate into the ground.
Permeable rocks make rivers to flow irregularly as may end abruptly.
Rocks of uniform hardness influence rivers to develop either dendritic, radial and parallel patterns if other factors remain constant.
(c) Relief / topography.
Sloped topography develop rivers as water make flow from the areas of upland towards the areas of low land.
The extensive flat low lying topography influences the occurrence of swamps as bodies of shallow stagnant water occupying flat low lying areas.
Depressed topography encourages the occurrence of lakes. Moreover, may influence the occurrence of centripetal pattern.
The conical shaped uplands encourage the occurrence of radial drainage pattern.
Important drainage description hints.
When describing drainage of an area from the given topographical map, the following if possible as important hints should be given.
Given the statement in connection to what you need to describe about the drainage of the area from the map.
Identify the main features of drainage in the area as observed from the map. These may include; swamps, rivers, lakes, etc.
Give the location of each feature on the map with reflection to the actual area represented.
Give the characteristics of the identified drainage features like coverage, patterns, direction, seasonality, etc.
For instance:
Qn. Describe the drainage of the area.
ANSWER
Drainage refers to the removal of the surface water from an area by the layout of water bodies.
Therefore, the drainage of the area as observed from the given topographical map is described as follows. The area is drainage systems of river, swamps, and lake.
Rivers; these are the flow of water in definite channels. They largely drain the area particularly the northern part where the landscape is comparatively higher and most of the rivers start to flow towards the southern part where the landscape is comparatively low. The rivers observed to occupy dendritic pattern. Some of the pronounced rivers include of Malela, Kitungwe, Kitogota, Lusingo, Kuga, Mbingu and others which might be present in the area.
Swamps; These are the bodies of stagnant water which are observed to occupy flat low lying lands and in are all seasonal. These observed in the southern part of the area where the landscape with observation to contours is almost level. Swamps in the area make drainage by receiving surface water drained into from rivers.
Lakes; These also make considerable drainage in the area. These observed in south east part where the landscape depressed. The most remarkable lake is that of Mnyamani and make drainage by receiving water discharged into it by rivers.
EXERCISE
Qn. Explain how the drainage pattern of the area is related is related to relief
(NECTA, 1993 …..THE MAP EXTRACT PART OF Tanzania – Dodoma west
(sheet 162/1).
Qn. Comment on the drainage pattern of the area. (NECTA 1995 – the map extract of part of Tanzania – KILWA KIVINJE (sheet 256/2).
Qn. Explain the main factors which have influenced the drainage system of the area. (NECTA 2000, the extract Madukani series Y742).
Qn. Describe the drainage pattern of the area. (NECTA 1987 the map extract
part of Tanzania provided (sheet 55/3 series Y72.)
Qn. Comment on the drainage in the area. (NECTA, 1985 the map extract part of Tanzania provided (sheet 55 series Y742).
Qn. Explain the relationship between relief and drainage of West Hai. (NECTA 2007, the map of WET HI, (sheet 56/1).
Qn. Explain how drainage pattern of the area is related to relief (NECTA 1991, the map extract of part of TANZANIA Fig.1).
4.ROCKS NATURE
Rocks are the aggregate or mixture of materials in solid form contented with minerals. Rocks are extremely varied and popularly include; igneous, sedimentary and metamorphic rocks.
The rocks of an area in exception of the out crop rocks and coral reefs are not directly shown on topographical maps. Rock nature can be identified by taking into consideration of the geographical facts related to geology which commonly shown on maps. These include the following:-
(a) Landforms:-
Land forms are good guide to rock nature identification of an area from a topographical map.
The presence of volcanic landforms on the map.
– Like crater, caldera, conical hills and mountains and others, reveals the igneous rocks of both intrusive and extrusive.
The presence of coral reef reveals the organically formed sedimentary rocks.
The presence of depression, sand dunes, and beaches reveals existence of less resistant rocks of which easily worn out into residuals to form such landforms by accumulation.
(b) Drainage features:-
Drainage features in areas strongly related to the nature of geology. It is thus; consideration of the drainage features may helps to realize the existing geological nature:-
The presence of dendritic, parallel and radial drainage patterns reveals the presence of hard rocks. Commonly such river patters develop on landscape of uniform hard rocks.
The presence of swamps and lake reveals the existence of impermeable underlying rocks which limit the percolation of water into the ground.
(c) Vegetation:-
Certain vegetation much related to geological nature of areas. Therefore; the consideration of vegetation may help to suggest the nature of rock of an area.
The presence of thick forest; and crops of coffee and tea suggest the existence of igneous rocks. It is so as such plants found where the soil is fertile. In consideration, most of fertile soils are derived from volcanic igneous rocks.
The presence of poor vegetation suggests the existence of sedimentary rocks as such rocks have low ability to retain water for plants.
Note:-
Metamorphic rocks have poor indicators (evidence). Probably, the presence of poor vegetation may reveal the existence of such rocks.
5. RELIEF
Relief refers to the physical appearance (surface form) of an area by landforms of contrasting shape and size.
The realization and description of relief of any area from a topographical map is by observing the patterns of contours and their respective heights. The arrangement (pattern) of contours reflects the surface form physical appearance), while the numbers reflect the altitudes.
In common, the relief of the area can be of either highland or low land. The area is recognized to be of high land if is of high altitude above 500m from the mean sea level. Lowland is recognized if the area has low altitude of below 500m from the mean sea level.
RELIEF PATTERNS OF AREAS.
The common relief patterns recognized from the topographical maps and up on the areas represented include the following.
(a) Mountain landscape:-
Mountain landscape is a surface form that rises more steeply or abruptly to summits above the surrounding area over wider area. On a topographical map mountain landscape is recognized, if contours lie so much closely to one another over a considerable wider part. Moreover; the map by contours shows many hills or summits, dissection of rivers (streams), the presence of passes, saddle, water shed and escarpments.
(b) Plateau landscape:-
It is an extensive highland area, generally, level or gentle sloped at summit. On a topographical map is recognized if the landscape is assessed be of high altitude and wider part is almost level or gentle sloped. Thus; the contours observed to show higher height numbers and lie far apart to reveal a general level, and might be dissected by rivers.
(c) Hilly landscape:-
It is an area predominated by numerous isolated hills. On a topographical map is recognized if the contours or roughly round close to one another appear numerous and isolated.
(d) Coastal plain:-
It is an extensive area of low altitude lies immediately after the sea. The lowland Coastal plain is recognized if contours on the map are widely spaced and the elevation rarely exceed above 300m. Beside to this, the mapped area is observed to lie immediately after the sea.
(e) River basin:-
The lowland of a river valley is recognized if the mapped area is observed to lie parallel to the big river and the contours show low height numbers.
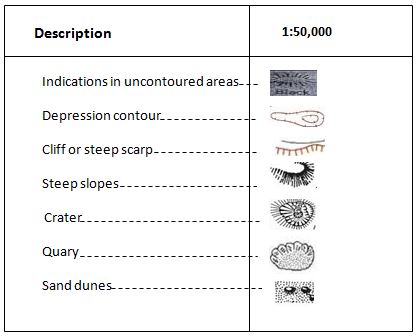
Important relief description hints.
Generally, in making description about the relief of the mapped area, the following hints should be followed.
The map has to be divided into relief regions. This is done by observing contrasting contour arrangements.
Give the position location of each relief region as shown on the topographical map.
Give the general description of each relief region by giving out the prominent landforms and altitudes of each region.
EXERCISE
Qn. Describe the relief of the mapped area. (NECTA 2002, the map of part of
KENYA – NYAKWERE).
Qn. Describe the relief of the area shown. (NECTA 1996, the map extract Y742
55/3 or ARUSHA (reproduced from the same series).
Qn. What type of landscape does the map depict?
(NECTA 1995, map extract of part of Tanzania – KILWA KIVINJE (sheet
256/2).
Qn. With specific evidences on the map, suggest the landscape patterns that
predominate in the area.
(NECTA 2003, the map extract of SONGEA sheet 299/1).
6. GEOMORPHOLOGIC PROCESSES.
Geomorphologic processes refer to the natural activities (physical processes) which mould an area by resulting into the occurrence of landforms. Geomorphologic processes moulded the area from the topographical map, realized and suggested by taking into consideration of the following.
(a) Land forms.
The presence of volcanic land forms such as craters, caldera and volcanic hills and mountain reflects vulcanicity.
Presence of block Mountains reflects crustal uplift by earth’s movement.
The presence of escarpment reflects both faulting and denudation.
Presence of sand dunes, delta, beach, flood plains and levees reflects deposition.
(b) Drainage.
Presence of rivers and lakes suggests erosion and deposition provided the formed related features observed on the map.
Presence of oceans reflects marine erosion and deposition provided the related features such as cliff and beach respectively observed on the map.
7. COMMUNICATION.
Communication in most of areas is enhanced by the means of transport and telephone networks. Hence on topographical maps communication is recognized up on the presence of the means of transport, telephone lines and telephone towers.
FORMS OF TRANSPORT
The topographical maps may show one or more forms of transport with reflection to areas represented. These include the following.
1. Land transport;-
This form of transport is by road, tracks, railway lines and foot path.
(a) Roads:- These are of the varied nature and include the following:-
All weather road bound surface. They are tarmac roads and normally used throughout the year including during the rainy season.
All weather road loose surface; they are murram surface road and also used throughout the year.
Dry weather road; These are also murram surface roads, but
(b) Footpath:-
These are the ways through which people move from one area to another on foot.
(c) Rail transport;
It is reflected by the presence of railways; and these may appear on the
topographical map provided the represented area is served by this particular means of transport, or the railway line pass through the area.
Railway lines as observed from the topographical maps with reflection to areas represented, are of two categories and include the following.
Main railway lines; These on the topographical maps represented by the black shading which alternate with white ones.
Light railway lines: These are normally present with in plantation and mining areas. These are represented by the thin black lines which may be pecked.
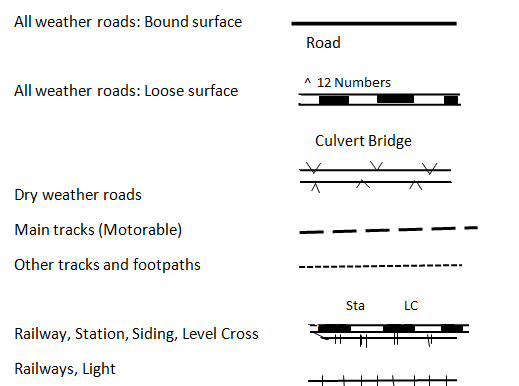
2. Air transport
Air transport about areas can be realized if the following observed on the topographical maps
(a) Air port. This is a large area on the ground which is used by commercial airlines to land or to take off. It has facilities for passengers, goods and offices including of immigration.
(b) Aerodrome. This is small airport that is mainly used by private air craft.
(c) Airfield. This is area of open and level ground where aircraft may land or take off. These normally have offices for air craft operations. However; the offices are not as large those of air ports. Airfield runway can be bound , murram or grass

3. Water transport:-
Water transport on the topographical map with reflection to the area represented is revealed by the presence of ports, big lake, sea and ferry across the river, lake or part of the sea; wharf, berth, jetty and pier.
Wharf is a wooden or stone structure that is constructed at the water front onto which boats or ships are tied when they are being loaded or off loaded.
A berth is the space on the side of the wharf which is set aside for a ship to anchor.
A jetty is a structure that is built out into the water for breaking the waves. This keeps the water calm on the side of the land. It may have also serve as a landing place.
A pier is a structure which is made of wood, iron or stone. It is built out into the lake or sea for walking on and for ships to stop and load or unload. Pier is bigger than jet and may have restaurant on it.
FACTORS INFLUENCING TRANSPOTATION.
It has to be noted that; types, layout and quality of the means of transport as observed on maps with reflection to the actual areas represented influenced by the following factors.
1.Relief.
Relief being the physical appearance of an area influences both; layout and types of transport as follow.
Roads and railways avoid to pass through areas of steep slope and are more liable to pass through areas of gentle slope. Thus; the layout of the overland transportation is observed in areas of gentle slope as such areas are less expensive for construction and also less hazardous.
However, roads have more advantage than railway in this respect as motor vehicles can travel more easily uphill than trains.
2. Drainage.
Roads and railways avoid to pass through areas with many rivers and very flat areas liable to floods. It is hazardous more expensive to establish means of transport through areas of this nature.
3. Economic activities.
Means of transport are made to pass through the areas where economic activities are carried out to facilitate the carriage of the economic goods.
4. Settlements
The layout of roads and railways is observed in areas where human settlements exist to facilitate the movement of people as well as their goods.
In urban areas; air transport observed and other means transport of high quality. It is unlike to rural areas.
Important transportation description hints.
To interpret communication, some one has to study carefully the map key to detect the convention signs representing means of transport and relate them to a map face and the following hints can be given.
Give the statement in connection to what you are going to describe about the area from the map.
Identify the main means of transport in the area as observed from the map. These may include; land transport, air transport and water transport.
Give the characteristics of the identified means of transport like; layout, quality and others.
EXERCISE
Qn. With reference to the relief and settlement pattern of the area, account for the type, lay out and quality of over land transportation. (NECTA 2006, the map extract of Mpanda sheet 153/3)
Qn. Describe the nature of transport as seen on the map (NECTA, 1997 – the map extract of MOSHI series Y742).
Qn. Explain the communication of the area and show they are influenced by physical features. Comment on how the communication might be developed to meet future needs. (NECTA 1980, the map of TANZANIA – MINGOYO Serial Y742 sheet 295/1 Edition 1 TSD 1967).
Qn. Relate settlement distribution and communication lines to relief and drainage. (NECTA 1985, the map extract part of Tanzania provided (sheet 55/3 series Y742).
Qn. Comment on the transportation system of the area 56/1.
8. SETTLEMENTS.
Settlement is a layout of dwellings in the habitable area where people live and conduct their social and economic activities by interaction with the prevailing environment.
A good number of topographical maps show settlements so long they represent areas in which people dwell.
Settlements on the topographical maps are given by means of selected conventional symbols.
There are two type of settlements which commonly shown on the topographical maps and these include; rural and urban settlements.
Urban settlement.
Urban settlement is commonly found in areas of the following nature.
District administrative centers.
Regional administrative centers.
Capital city of a country.
Areas with transportation system junction.
A good number or people approximated to over 80% in urban areas engage in non-agricultural activities mostly trade.
On the most topographical maps; urban settlements realized by the presence of the sign indicating the built up area.
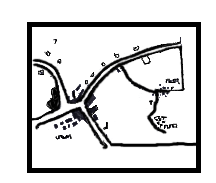
Rural settlement
Rural settlement is in areas where the majority of people approximately to over 80% engage in agriculture shown by means of the black round dots. Thus; on topographical maps rural settlements realized by the presence of the black round dots.
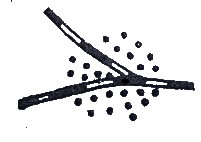
SETTLEMENTS PATTEERNS
The signs showing settlements on topographical maps are observed to have varied arrangement. With respect to this, settlements on topographical maps and up on the areas represented recognized be in varied patterns. The most common patterns include the following.
Dispersed pattern.
It is alternatively called scattered settlement pattern. The houses are widely spaced one to another. It is very common in areas of the following nature:-
Scattered cultivation.
In areas where the individuals farms are large enough and population is too sparse.
Pastoral societies.
Newly established settlement area where the houses are few and thus may lie far apart.
Evenly distributed of water sources. This makes settlement put in any suitable place.
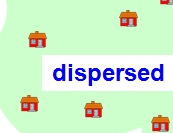
Nucleated settlement patterns:-
Houses and other related forms are compacted to one another. On the topographical maps, it is identified where the round black dots lie clustered or where black block lie in a specific area. This pattern is common in areas of the following nature.
Urban areas where people more concentrated.
Planned villages.
Where there is a single supply of a certain economic resource and every is one is on need of it.
The presence of economic factors like, industrial plants, mineral exploitation, plantation, and rich agricultural land.
Presence of the social amenities like; health and education.
Limited supply of water sources and this make people to stay very closely to it.
Limited spacing for building due to natural and artificial restrictions. This makes people concentrate in available small space as a result settlement becomes clustered. e.g. Relief barrier which makes people to concentrate in a small area of more less hazardous areas.
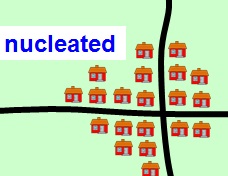
Linear settlement pattern
It this pattern, the dwellings are concentrated along an elongated object of economic significance like; a road, a river, a railway line and others.
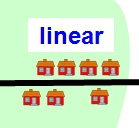
To realize and describe settlement, map user should be in position to observe the type of map symbols or sign that represent settlements.
On most of topographical maps as it has already been given; round black dots represent rural settlement; where as rectangular or square signs represent built up area like that of a town or a single building like market.
The way in which symbols and settlements are distributed on the map and up the area represented, is due to the many factors. Some have encouraged settlements and others discouraged.
Factors encouraging settlements.
A reliable source of water supply. E.g. the presence of permanent rivers, lakes, dams, ponds, wells, or bore holes on the map. These are mainly used for domestic purposes as well as irrigation.
Good soils for agriculture. This favours the cultivation of crops.
Pleasant climatic conditions, which can be favouring kinds of crops cultivated and natural vegetation.
Gentle slopes. People mostly prefer to establish settlements in less hazardous areas. Hence settlements are likely to be observed where the contours are reasonably wide apart, but not so wide apart. Gentle slopes provide a suitable gradient for the construction of means of communication and homes. More importantly soil erosion and mass wasting are less common.
Transport and communication. Transport routes and especially roads, attract large settlements along side them. These largely ease the movement of people as well as their goods to else where of interests.
Social amenities. Settlements tend to increase where amenities such as health and education exist. With respect to this, on maps there is high concentration of dots where the amenities exist.
Factors deterring settlement.
Marshy or swampy areas. Usually symbols for seasonal or permanent swamps will be printed on such areas. More importantly the contours are very wide indicating flat lands liable to floods.
Steep slopes. Steep slope give difficulties for road and railway construction. Erosion may be common and growing of crops is also difficult steep slopes on maps recognized if contours lie so closely to one another.
Reserved area. These are the areas where a settlement is prohibited by law. These are known as government lands and reserved for national parks, games reserve or for future government plans. On the maps indicated in words.
Unpleasant climatic condition. e.g. prolonged drought. This gives difficulties to cultivation of crops and water supply for domestic use and other purposes.
Lack or shortage of water supply.
Lack of the social amenities, transport and others.
FORMS OF POPULATION DISTRIBUTION.
Because of the factors, population distribution as observed on maps and up on the area represented is not even and makes varied forms related to is including the following.
Densely distributed settlements.
An area is described as being densely settle, where there is a high
concentration of settlements. On the topographical map, dense settlement are indicated by high concentration of dots or blocks of black squares. It is therefore where the concentration of dots appears very high, the population is described being very dense.
Moderately distributed settlements.
An area is described as being moderately settled, where the number of dots is moderate in quantity. i.e. Note very many and not very few.
Sparsely distributed settlement.
An area is sparsely settled where a few dots are spread over large area. It is therefore, where the dots are very few; the distribution of the settlement is described as being very sparse.
Important settlements description hints.
Give the statement in connection to what are you need to describe from the map about settlements.
Indentify the main types of settlements in the area as observed from the map whether rural, urban or both.
In each type give the distribution, patterns and if possible the influencing factors.
For instance:
Qn. Describe the settlement of the area
ANSWER:
Settlement of the area as observed from the given extract map is described as follow.
The area has both urban and rural settlements.
The urban settlement observed on the eastern part of the mapped area where the area is heavily built up and form nucleated pattern. The location of this is assessed to have been influenced by the gentle topographical reasonable, lay our of transportation systems and the presence of so many social amenities like health.
Rural settlements make mostly case in the area. These observed almost every where in the mapped in exception of the eastern side.
However, rural settlement observed to occupy two patterns of nucleated and scattered. Nucleated is much observed in the northern and southern parts due to availability of social amenities and the presence of gentle topography.
Sparse settlement pattern observed in the central part due to the presence of scattered cultivation.
EXRICISE
Qn. Using the map extract given write short notes on:-
Settlements. (NECTA 2005 – the map extract of Musoma sheet 12/2).
Qn. Give account on population distribution of the area (NECTA, 2006 – the
map extract of Mpanda sheet 153/3).
Qn. Explain how the sites of some towns and villages and water south of 10 05
South are related to relief and water supply. (NECTA 1980, the map extra
part of TANZANIA MINGOYO.(Series Y742 sheet 295/1 Edition 1 – TSD
1967).
9. HUMAN ACTIVITIES
Human activities are of two categories and include:
Social activities.
Economic activities.
Social activities
Social activities include the ones conducted to meet social motivation like; education, medical care, security, entrainment and others. etc. The identification of these activities from the topographical map is as follows.
Education; Identified by the presence of schools, collages, education centre etc.
Worship; It is identified by the presence of church, mosque, mission schools and others which reveal the same.
Health care; Identified by the presence of hospitals and dispensaries.
Entertainment; It is identified by the presence of clubs, res house, hotels, motels and others which also the same.
Security; It is identified by the presence of police station or police post, military camps, prisons and others of related.
Economic activities.
Economic activities are the ones conducted by people for purpose of earning livelihood. These are for income earning to improve economic growth of an individual or society as a whole. Economic activities include; trade, tourism, mining, manufacturing industry Pastoralism, crop cultivation/agriculture and others.
Topographical maps have much that involves the development and exploitation of woods from green resources of forest. On the topographical maps,economic activivties can be identified by the presence of the following.
1. Lumbering
Lumbering is an economic activity that involves the development and exploitation of woods from green resources of forest. On the topographical maps, lumbering can be identified by the presence of the following:-
Saw mills; these are for processing of woods.
Forests, the natural resources from which wood exploited.
Minor roads ending into the forestland, these established purposely to transport logs to saw mills.
2. Crop forming.
It involves the development and cultivation of crops. It is the one of the basic and most widely spread human activities in Tanzania, East Africa and else where in the world.
Crop forming in the area with reference to the topographical map provided. Can be identified by the presence of the following:-
The directly shown large scale farms (Plantation), on the map e.g. sisal estates, cashew nuts plantation etc.
Rural settlement in a basis that, over 80% of people dwelling in rural areas engage more directly in agriculture.
If the area is assessed to experience suitable climate conditions for crops cultivation e.g. reliable rainfall.
Presence of water bodies like, rivers, dams which can support irrigation agriculture.
Presence of crops processing industries like; ginneries, decorticators and hulluries.
3. Livestock keeping.
Livestock keeping is among the human activities which based on domestication of animals of like; cattle, goats, sheep etc. on a topographical map, livestock keeping can be identified by the presence of the following:-
Grassland with scattered settlement as people in grassland areas engage in animal keeping as their reliable source of earning livelihood.
Presence of ranches and diary farms.
Veterinary centers. These are the stations in which treatment and vaccination given to the domesticated animals. They are commonly established in areas where live stock keeping is conducted.
Dams and bore holes. These have been constructed in many areas for domesticated animals.
If the area is assessed to experience aridity condition and there is the presence of scattered settlement. In consideration on arid areas crop farming is of difficult and thus, people earn lively hood mostly by engaging in animals keeping.
Cattle markets. These commonly established in areas where animal keeping is conducted.
4. Mining and quarrying
Mining involves the development and exploitation of minerals from the ground and other sources. The activities from the topographical map can be suggested by observation of the following.
The presence of the conventional signs indicating mineral works. Usually signs for minerals works are interpreted in the map key.
Sometimes, the presence of lakes in valley may guide you suggest the activity due to the fact that, such lakes are exploited for salts and soda.
Presence of quarries.
5. Fishing.
Fishing activity involves the development and exploitation of fish from the water body systems of rivers, lakes and ocean.
From the topographic maps, finishing is suggested by the presence of the following.
From the topographical maps, fishing is suggested by the presence of the following.
Small settlements along the coasts of sea, lake and large rivers. It is so as lakes, rivers and seas provide good basis for fisheries. Beside this, people living along the water courses are fishermen oriented.
Presence of fish ponds, fishing cooperatives societies, fishing colleges, fishing villages etc.
6. Manufacturing industries.
These are the activities which involve the turning of organic, inorganic, refined raw materials by chemical and mechanical means into new products. On topographical maps manufacturing industries can be observed by the presence of the following.
Factory special symbols which indicated on the map interpreted in the map key.
Presence of township characterized by having high concentration of transport networks of road railways. It is so as manufacturing industries follow urban centers to have accessibility to markets, transports, and labour supply.
Presence of industrial area as directly shown on the map.
7. Trade.
Trade is an exchange of goods and services. Trade can be identified by the presence of the following:-
Township as the majority in towns engage in non agricultural activities including trade.
Transport network of roads and railway together with settlement. These normally facilitate the movement of people for trade purposes, and also facilitate the exchange of goods and services.
Presence of other economic activities.
8. Tourism.
Tourism is suggested by the presence of the following.
Historical sites like museums indicated by some signs on the map.
Attractive landform such as craters, mountain, beaches etc.
Hotels, motels and rest house, recreation centes.
Presence of national parks, game reserve and forest reserve
Topographical map interpretation is an indispensable part of geography that equips students with the skills to accurately understand and analyze the Earth’s surface features. By learning to read symbols, comprehend scales, and interpret contour lines, students gain a deeper insight into the landscape and its various elements. These skills are not only vital for academic success in geography but also have practical applications in fields such as environmental management, urban planning, and outdoor activities. As students continue to practice and apply these techniques, they will develop a keen ability to navigate and make informed decisions based on topographical maps, contributing to their overall proficiency in geography. Welcome once again to nectaexams.com, your go-to resource for the best study materials and educational support in Tanzania.


